Transformation · Education

Stack ranking target schools based on which ones could buy, across 34 districts.

An education company was sending sales teams to districts without knowing which schools could buy. Every school was assessed on its ability to buy and ranked, so sales teams went straight to the schools most likely to convert.
Education technology
Private school partnerships
Multi-state expansion
34 districts across multiple states

What the screen produced

Thirty-four client-selected expansion districts, every private school assessed.

34
Districts
Client-provided expansion territories across multiple states.
~27,000
Schools screened
Every private school in those districts, drawn from the national education registry.
~8,000
Qualified targets
Schools clearing the ideal customer profile, scored and ranked within each district.
~30%
Qualification rate
The share of schools in these territories that meet the profile. The remainder are ruled out before a visit.

The case

01 · Expansion without a denominator

Thirty-four districts, no target count

Leadership selected the districts. Nobody could say how many schools in each one could realistically become customers.

02 · Registry data does not rank

Listed does not mean qualified

The national education registry names every school. It does not say which ones have the fee base, scale, or infrastructure to buy the product.

03 · Field teams enter blind

New markets, no sequence

Representatives entering an unfamiliar district had no ranking to decide which schools to visit first or which districts to staff.

From 27,000 schools to a ranked list of 8,000

EPIC screened every private school in the 34 expansion districts against the ideal customer profile. The output is a per-district target list, scored and ordered so field teams work from the top.

~27,000
schools identified
Every private school across the 34 districts, drawn from the national education registry.
→
~8,000
qualified
Schools clearing the profile on board, scale, facilities, catchment quality and household spend.
→
34
district lists
One ranked target list per district, sized for field team allocation.
→
Day 1
go-to-market
Field teams received scored lists they could work immediately, with no local research required.
Proof of concept · Completed before the scale-up

The method was validated in a ten-postcode pilot

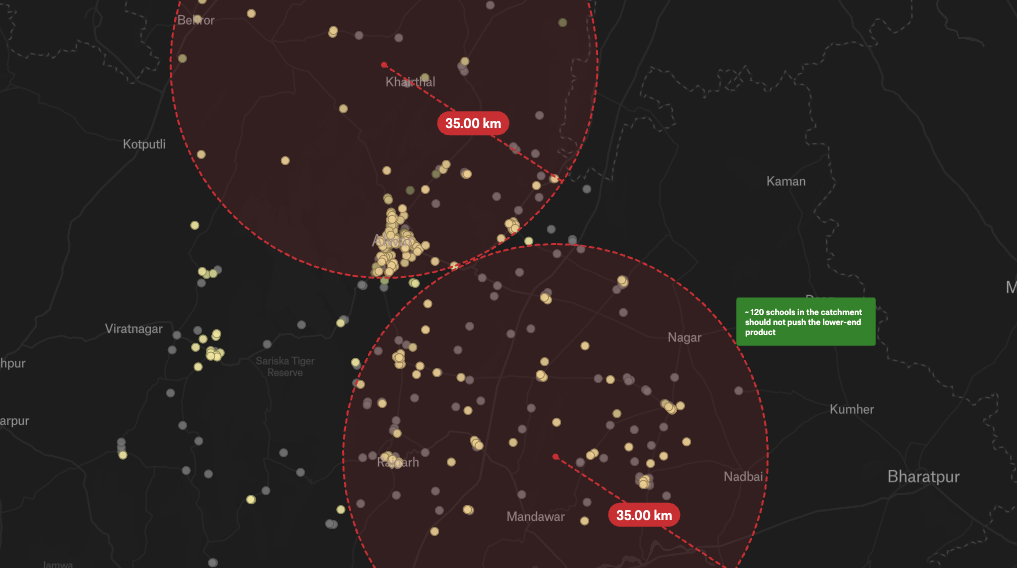
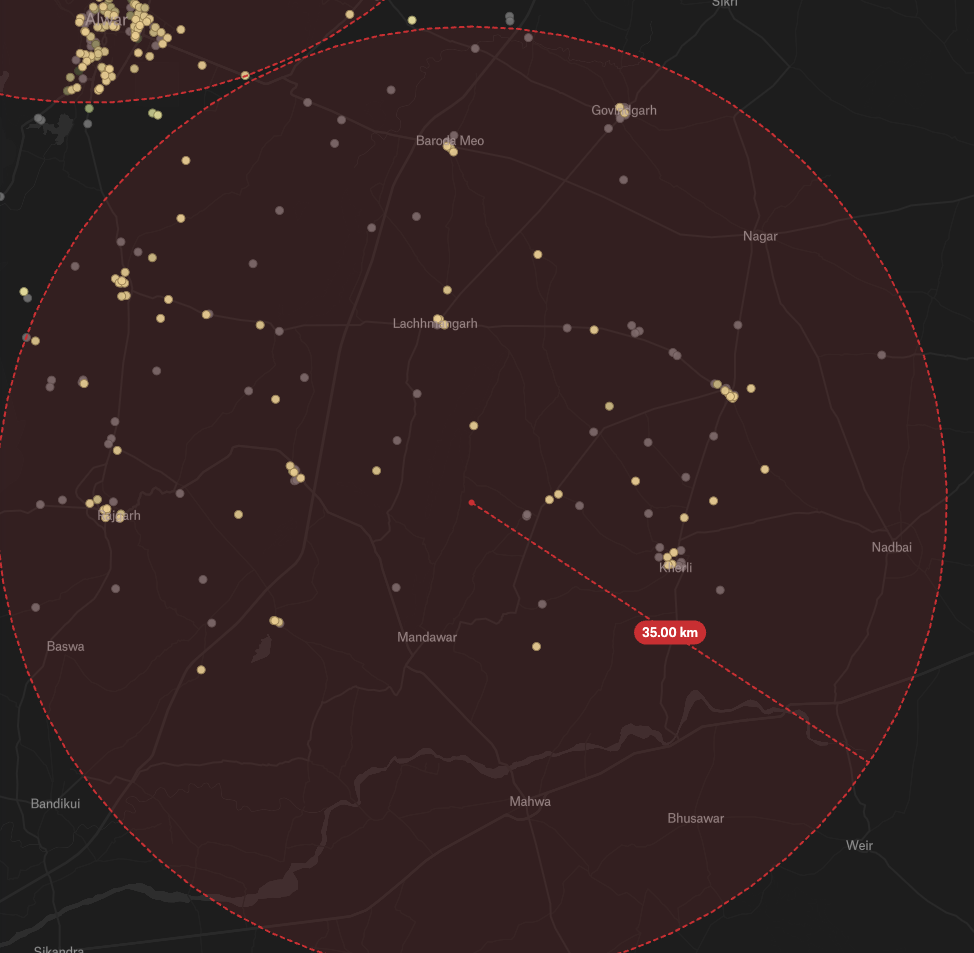
Before the 34-district engagement, EPIC ran the same screening across ten postcodes in two districts near a state capital. Of 1,073 private schools, 77 cleared the profile. Five of those were already partner schools, giving the company a measured 6.5% share of its own addressable market. The pilot confirmed that registry data, catchment signals and public reviews could reliably separate qualified schools from the rest.
34-district screening funnel

What was scored

Roughly 27,000 schools across 34 districts, each assessed on school-level registry data, neighbourhood signals and district-level economics.

Board and scale

Affiliation, student numbers, teacher counts and classroom counts from the national education registry.

Sets whether the school has the size and structure to run the product at all.

Facilities and infrastructure

Registered physical infrastructure at each school, used as a proxy for the fee base.

A school that charges enough to fund a paid programme shows it in its facilities, which the registry records.

Catchment vibrance

Points of interest and household density around each school, from mapping data and population estimates.

Parental ability to pay is a property of the neighbourhood. A school in a vibrant catchment draws from households that can afford supplementary programmes.

Public review signals

Review volume and average rating from mapping platforms.

Parent sentiment is publicly visible and separates a well-regarded school from one that is merely large.

Household education spend

District-level annual household expenditure on education, Z-scored across the national dataset to normalise for regional variation.
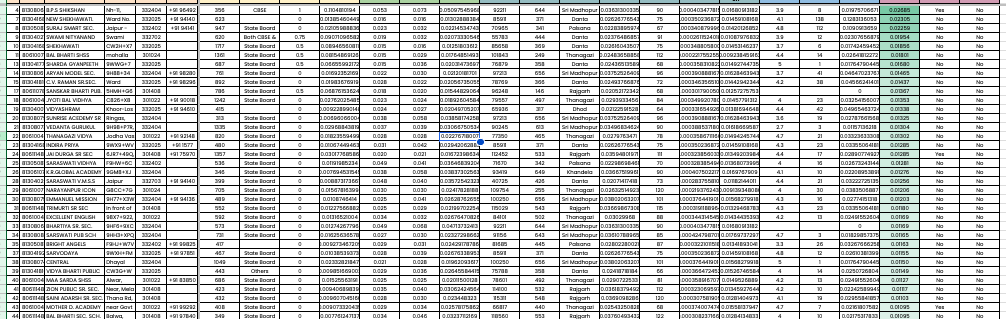
A district where households spend more on education is a district where the product has a larger addressable wallet.
Signal layers scored per school

Each district carries a priority and an action

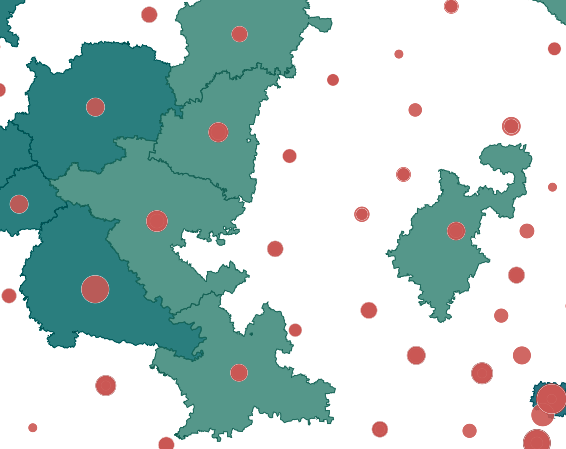
Districts were ranked by household education spend, private school density and the number of qualified targets. The ranking sets where the company staffs first.

District tier
Profile
Action
Priority
High household spend, large qualified pool, salesperson allocated at the 200-school benchmark.
Staff immediately, work the ranked list from the top
Opportunity
Moderate spend, meaningful target count, no salesperson allocated at the benchmark.
Cover on rotation, sequence after priority districts
Low-yield
Low spend or thin private school base, few targets clearing the profile.
Monitor, do not staff

What each team received

One scored dataset, abstracted for each level of the organisation.
District priority dashboard
Leadership

District priority ranking

Which of the 34 districts to resource first, based on the size of the qualified pool and the economic profile of the catchment.
Territory plan with staffing model
Expansion

Territory allocation by district

Per-district target counts and a staffing model benchmarked at 200 schools per salesperson, so territory plans are built from the qualified list.
Ranked school list for one district
Field

A ranked school list per district

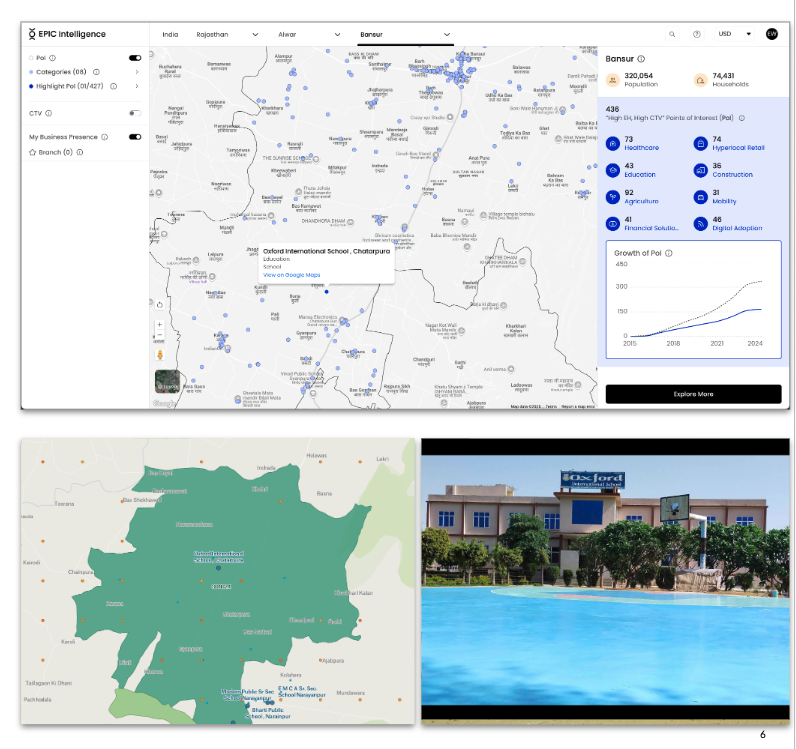
Named schools clearing the profile, scored and ordered within each district. The representative works from the top and stops when the territory is covered.

How the workflow changed

Before
Expansion districts selected with no measure of how many schools in each could buy
Field teams entered new markets with registry exports and no ranking
District priority decided by geography or executive judgment, without data
School fit assessed on arrival, after the visit was already scheduled
Staffing guessed without reference to the qualified target count
→
After
Each district carries a qualified target count and an economic ranking
Field teams receive scored, ordered lists they can work from day one
Districts stack-ranked by household spend, private school density and target volume
School qualification confirmed before the first visit is scheduled
Staffing modelled at 200 schools per salesperson against the qualified list

What the screen settled

Three questions the expansion plan could not answer without scored data.

Question
How many schools in these 34 districts can actually buy the product.
~8,000
Answer
Qualified targets identified from the registry data, scored against the ideal customer profile across all 34 districts.
Question
Which districts should be staffed first.
Ranked
Answer
Districts ordered by household education spend, private school density and target volume. Priority districts staffed at 200 schools per salesperson.
Question
What should the field team do on day one in a new district.
Scored list
Answer
A ranked list of named schools per district, ordered by composite score, ready to work from the top.
We get a limited window to sell to schools, and identifying the right fit schools increases conversion and retention.
Client Leadership
During scoping

The question that turns a scored list into a system. Verified fees, confirmed infrastructure and visit outcomes collected in the field are the same signals the registry approximates. Each visit either confirms the profile or sharpens it for the next district.

Score one expansion district.

Give us a district list and your ideal customer profile. We will return a ranked target list your field team can work from day one.

Set up a workshopMore Transformation Examples