Transformation · NBFCs

The right product for each branch, decided before it opens.

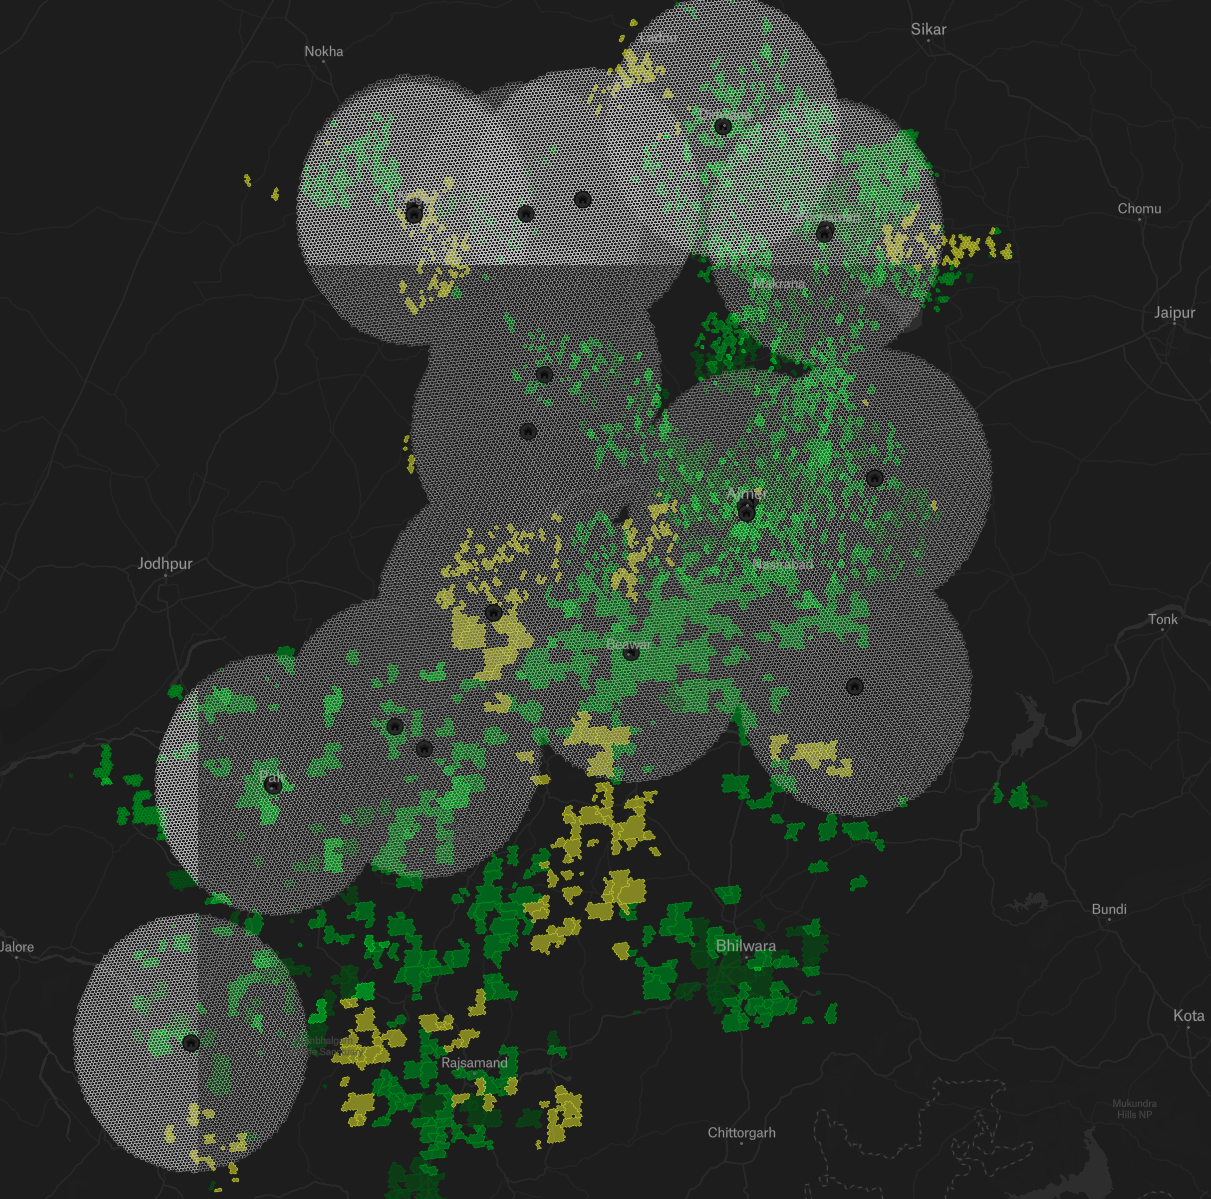
A diversified NBFC was opening locations on a single readiness view. Each catchment was assessed separately for vehicle loans, secured personal loans and gold loans, so the product mix could be set market by market.
Diversified NBFC
Multiple products per branch
Semi-urban and rural
One catchment, scored per product

The engagement, in four numbers

Scope agreed for the proof of concept. No outcomes have been measured yet.

50
Scope
Branches in the proof of concept.
~5,400
Scope
Hexagons per branch at a 35 km radius.
3
Products
Housing, JLG, and unsecured business loans.
900+
Branches
Overall size of the network.

The case

01 · Several products, one map

The catchment was treated as uniform

A branch selling multiple products worked the same territory the same way for all of them.

02 · Insight without a loop

Nothing closed back

Analysis could be produced, and there was no mechanism to confirm whether teams had acted on it.

03 · Definitions varied

Market classification was not shared

Thresholds that decide whether a market is worth working differed by each team, so comparisons did not hold.

One catchment, scored separately for each product

The same hexagons carry different scores depending on what is being sold. A market rich in small manufacturers suits one product. A market of salaried households suits another. Treating the catchment as one territory averages both away.

Same hexagon

Different answer per product

Scores are computed per product line rather than once for the branch.

Same method

Comparable across branches

Thresholds are set centrally, so two branches can be compared on the same basis.

Same cadence

Refreshed, not one-off

A one-time data pull is followed by ongoing monitoring against the recommendations.

What was scored

Each score is computed per hexagon at 400 metre resolution.

Construction propensity

Satellite overlays and mapping data indicating physical build activity.

Signals aspiration for property, which is the demand a secured product is written against.

Demographics

Age bands and household composition from population datasets.

Separates markets by life stage, which drives which product actually sells.

Formalisation

Registry presence, banking infrastructure and institutional density.

Determines whether a borrower in that market can be underwritten on documentation.

Natural hazard risk

Satellite overlays and historic incident records.

Flags markets where income is volatile enough to affect repayment in stress years.

Further score families sit on the roadmap rather than in the current build, including penetration against served population, agricultural output, healthcare burden, education quality and sectoral shortfall. These are named here as roadmap, not as delivered.

What the classification decides

The output answers a sourcing question rather than a ranking question.

Outcome
What it means
Action
Product fit
Which product the hexagon's economic profile supports.
Direct the right product here
Opportunity rank
Where the hexagon sits against others in the same catchment.
Set beat plan priority
Risk flag
Hazard exposure or business risk elevated enough to matter.
Apply tighter terms or avoid

What each team received

A one-time data build, then monitoring against it.

Leadership

Comparable branch views

Branches assessed on the same thresholds, so a shortfall in one catchment can be read against the market available in another.

Branch

Product-level sourcing guidance

Which product to push in which part of the radius, replacing a single undifferentiated territory plan.

Field

Monitored recommendations

Ongoing monitoring of whether sourcing moved toward the recommended hexagons, which is the feedback loop the business did not previously have.

How the workflow changed

Before
One territory plan served every product in the branch
Market thresholds differed between teams
Analysis produced without a way to confirm action
Branch comparisons rested on inconsistent definitions
Risk considered at portfolio level only
→
After
Each product scored separately across the same catchment
Thresholds set centrally and applied consistently
Monitoring tracks sourcing against recommendations
Branches comparable on a shared basis
Hazard and business risk carried at hexagon level

How the engagement was structured

Priced on area and complexity, with the monitoring layer carried during the proof of concept.

Basis
Pricing follows the size of the area analysed and the number of products in scope.
Per hexagon
Effect
A branch is priced on the ground it actually covers rather than as a flat seat licence.
During the proof of concept
Monitoring would normally carry its own cost.
Included
Effect
The feedback loop runs from the start, so adoption is visible before any scale decision.
At scale
Standard volume terms.
Outcome linked
Effect
A share of billing moves onto agreed outcomes as the deployment grows.
We're not opening new branches this year. The focus is to diversify secured loan book in specific markets. This helps us do that.
Client Business Team
During review

Start with one branch and two products.

We will score the catchment separately for each and show you where the two answers diverge.

Set up a workshopMore Transformation Examples