
Transformation · Healthcare
Where the next collection centre goes, tested first on the centres already open.
A national diagnostics chain was entering a new state at speed. The model was first tested on the centres it already ran, exposing overlap and weak placements, and then used to find sites across underpenetrated districts.
Diagnostics chain
Labs and collection centres
Tier 4 to 6 markets
.png)
What the analysis found
Two observations from the client network, and the scope they came from.
The case
01 · The retail pivot
A rollout measured in hundreds
The chain was moving into private retail collection centres in markets competitors had not reached.
02 · The scouting bottleneck
Expansion capped by executive calendars
Site selection ran on field scouting, with leadership travelling to each district to sign off in person.
03 · The reporting blindspot
Bad location, or bad execution
Consolidated reporting could not tell the two apart. The standard answer was usually more marketing.
The model was run backwards before it was run forwards
EPIC scored collection centres whose revenue performance was already known. The model separated strong sites from weak ones on data the business already held. Three findings shaped everything after.
01 · Revenue concentration
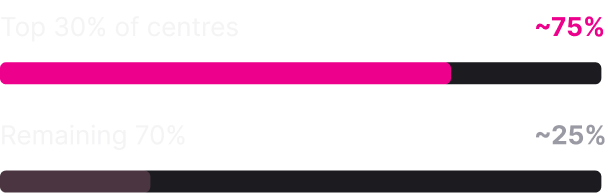
Three quarters of revenue from under a third of the network. A distribution this skewed points at placement.
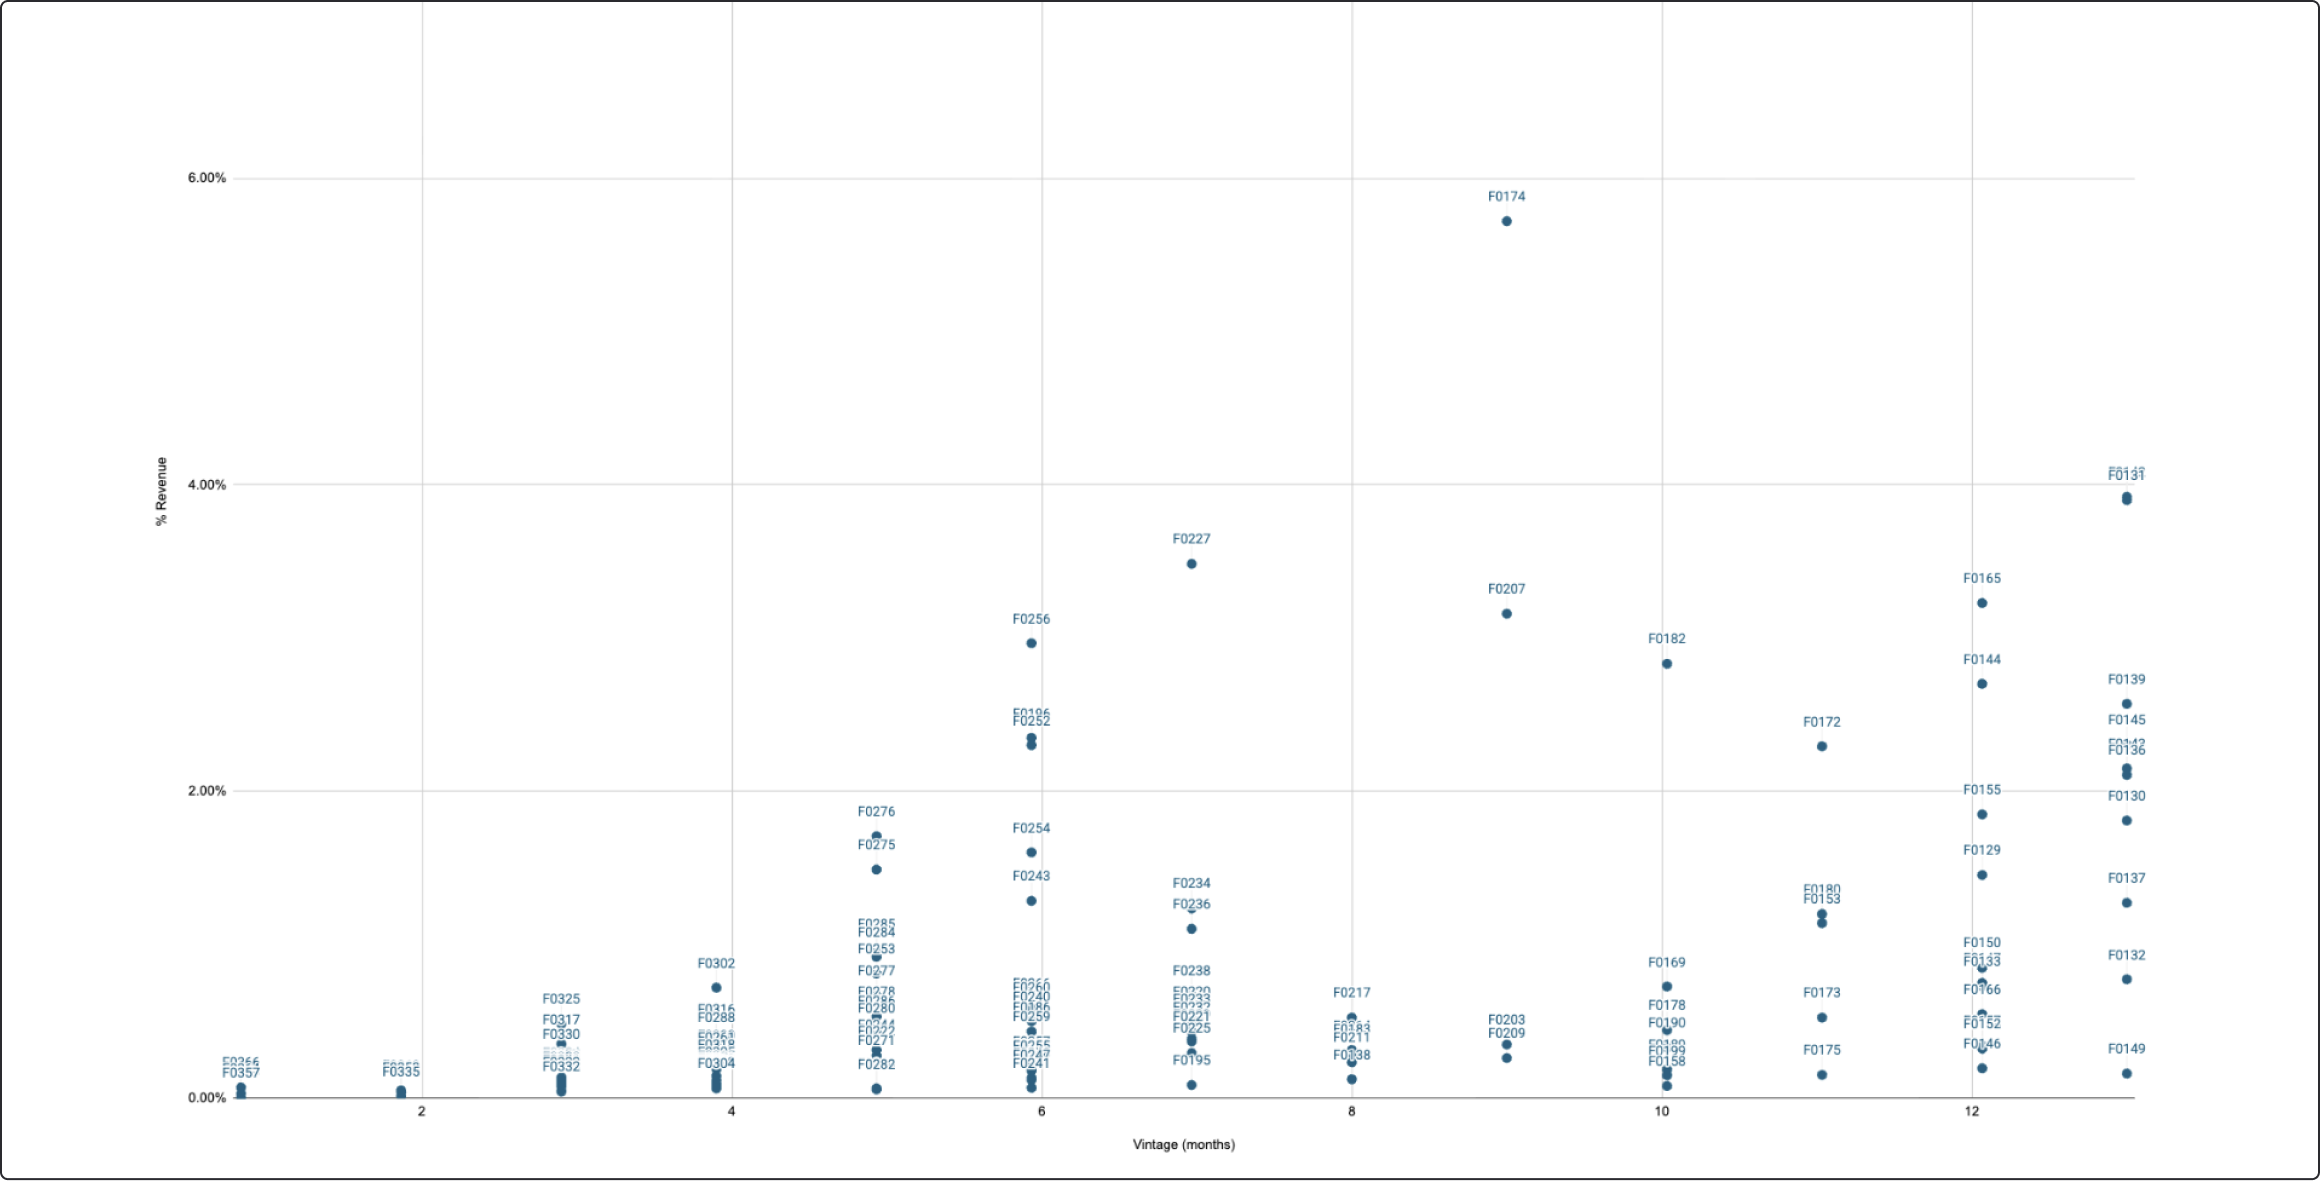
02 · The vintage paradox

Almost no difference. The assumption is that a new centre needs time to find its feet. The data says a badly placed centre stays badly placed.
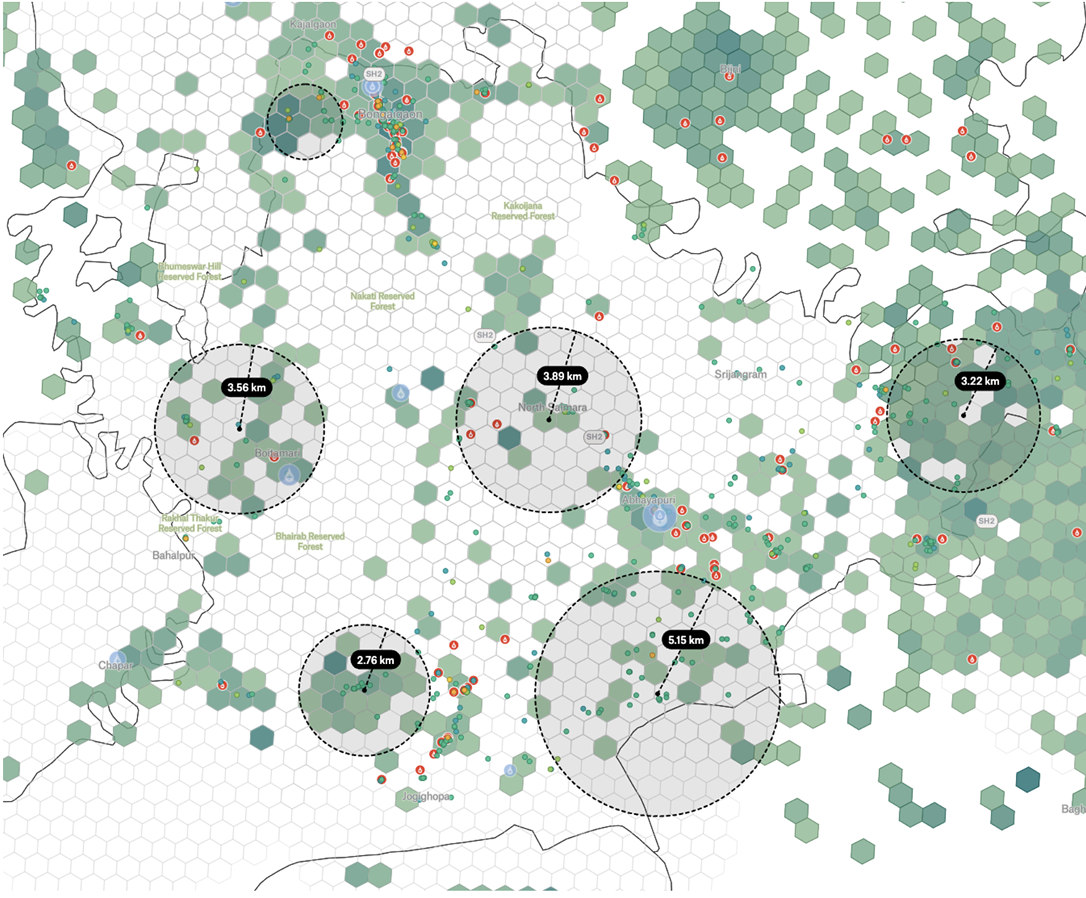
03 · Internal cannibalisation

Centres sharing a single 0.7 km² catchment.Two nodes splitting one patient pool, each looking weak in the MIS, while aggregate reporting hid the overlap.
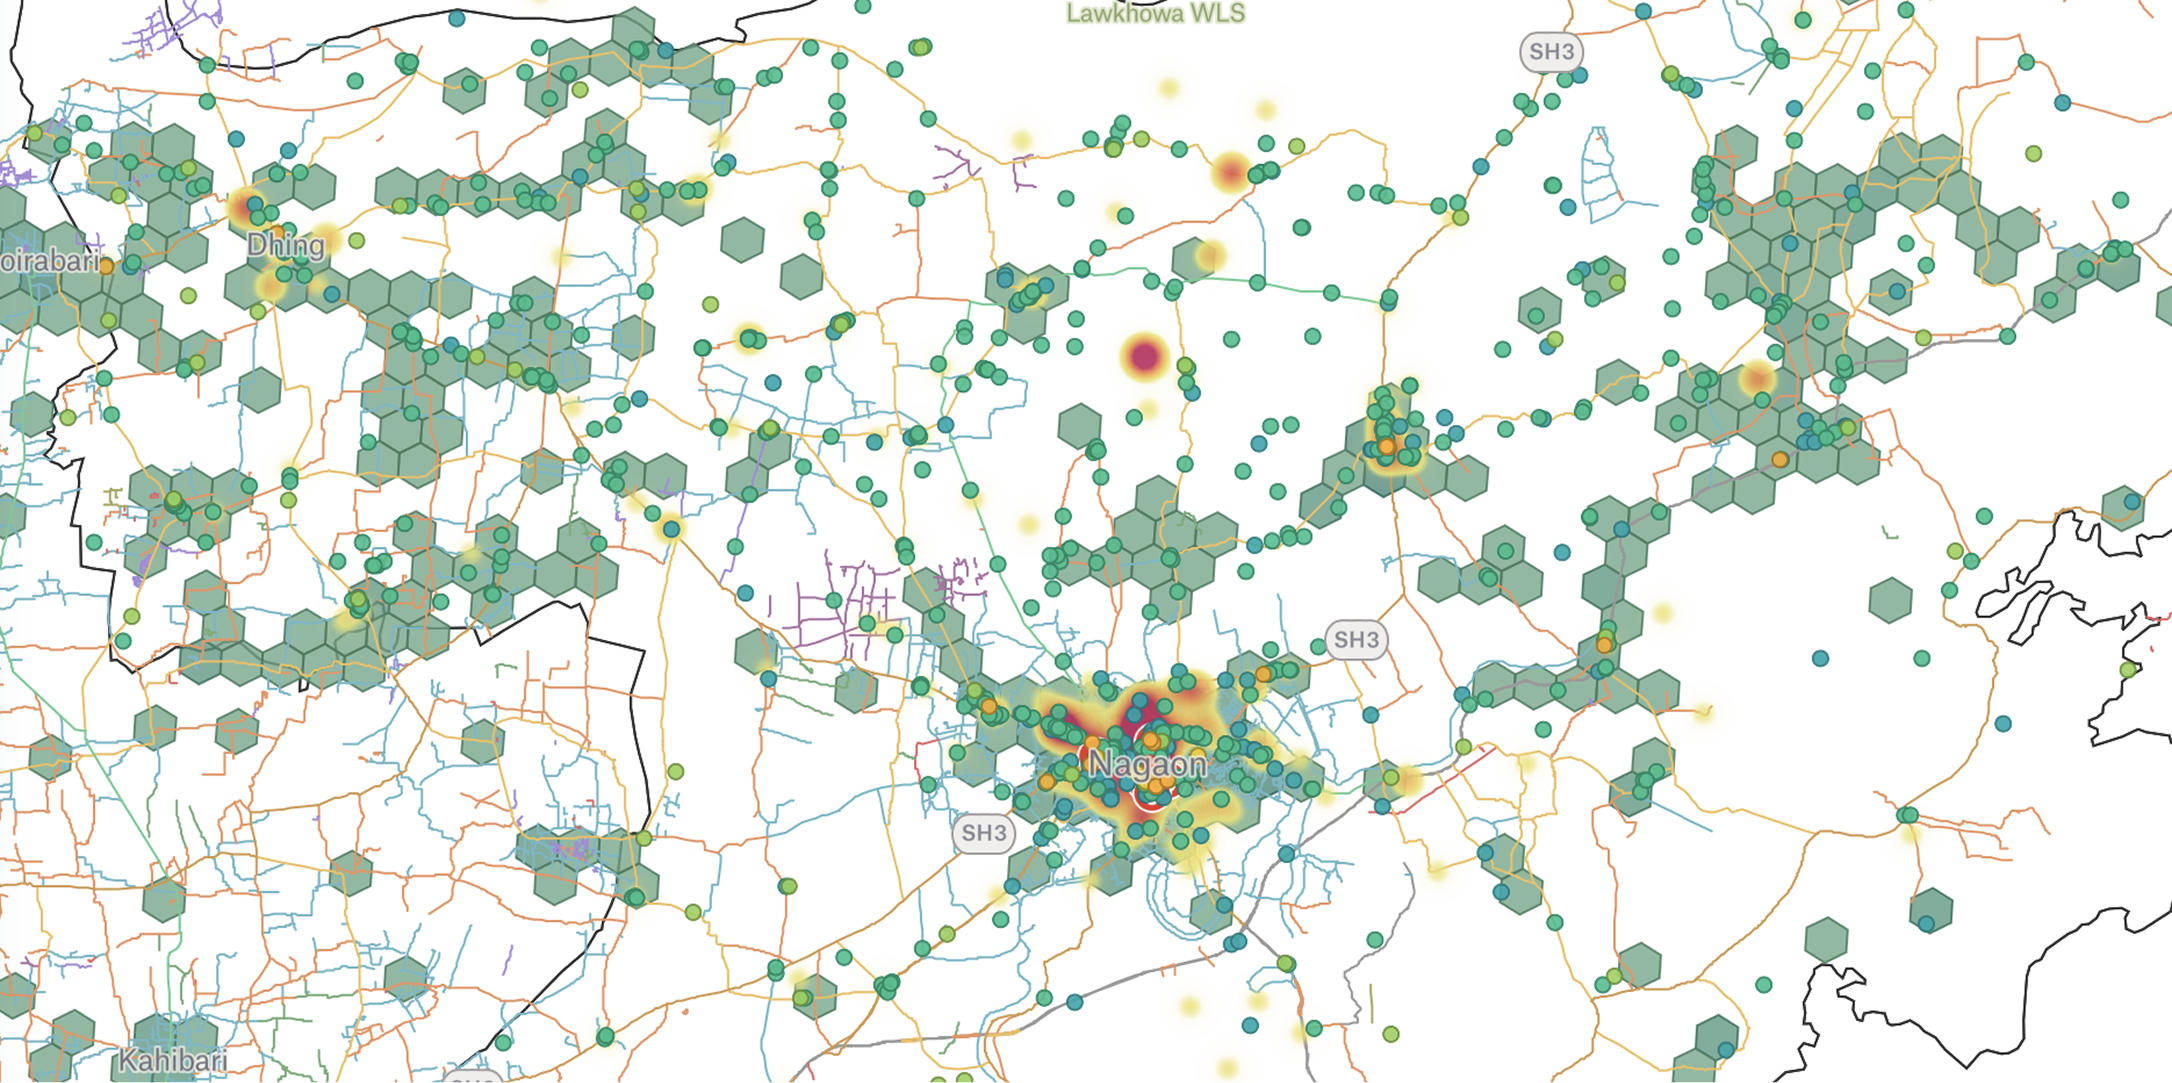
What was scored
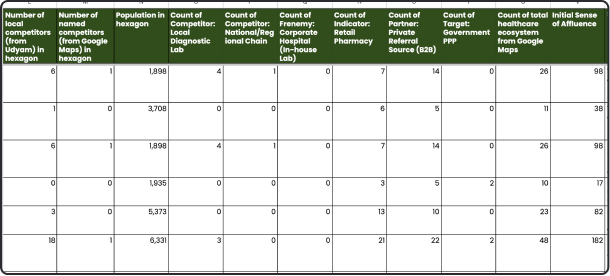
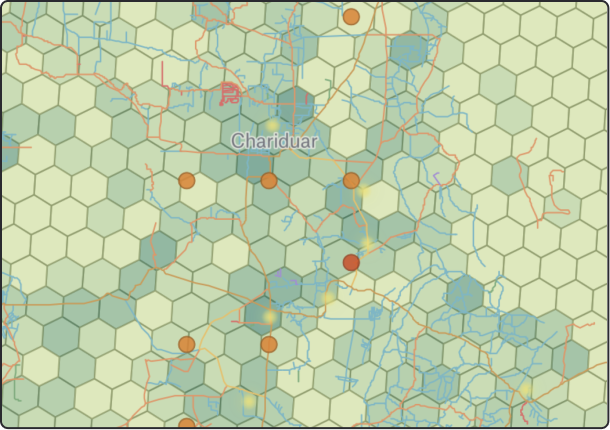
Each 0.7 km² hexagon carries over 100 signals.
Clinical points of interest
Clinics, doctors and hospitals across each catchment.
The closest direct predictor of sample volume.
Competitor footprints
Diagnostic labs, chains and hospital in-house facilities.
Establishes unsaturated volume, separate from total demand.
Micro-demographics
Ward-level population density and household income layers.
Matches catchments to high-value test panels.
Logistics and travel
Road networks and transit times to processing labs.
Ensures samples arrive within testing stability windows.
Three kinds of white space
Unserved markets differ in what they are worth and in how they should be entered.
Grade
Market profile
Strategic action
Priority Growth
Dense, affluent, clinic-rich catchments with zero chain presence.
Immediate high-confidence site acquisition
Clinical Corridors
High-volume hospital clusters with active sample flow already present.
Fast-track centres to capture immediate volume
Growth Fringes
Developing outer corridors where demand is still forming.
Low-cost early-mover entry before saturation
What each team received
One output per role, built around the decisions each one makes.
Leadership and board
Sign-off without the site visit
Data-backed virtual site reports replace travel to every district, and preserve the reasoning so location logic survives field team attrition.
Expansion teams
Ranked shortlists per catchment
Graded micro-markets within each lab catchment, with cannibalisation flagged before a lease is signed, and location scoring on prospective partners before onboarding.
Field operations
Spatial tools for the ground
Doctor outreach directed at dense patient pockets, sample-runner routes built around real catchments, and rep coverage rebalanced against sample demand.
How the workflow changed
Before
Field teams walked new states to find candidate sites
Leadership travelled to each district to approve in person
Centres opened inside each other catchments unnoticed
Underperformance was attributed to marketing
Site knowledge left when the field team did

After
Districts scored before anyone enters the state
Sign-off runs on virtual site reports
Cannibalisation flagged before a lease is signed
Location and execution separated in the diagnosis
Reasoning recorded and preserved through attrition
Where the return comes from
Three levers, modelled against the client district economics and agreed before work began.
These are projections, and they are stated as projections.
Status quo
Three field staff per district cluster scouting manually, plus leadership travel
to sign off.
50% leaner
With EPIC
Scouting sized against a shortlist instead of a district.
Status quo
Roughly 15% of new centres fail after launch, with signage, training and partner churn already sunk.
15% to 2.5%
With EPIC
Failure risk removed from the shortlist before capital is committed.
Status quo
Centres take six months or more to reach steady-state revenue because of weak initial placement.
3 months
faster
With EPIC
Stronger placement shortens the ramp to peak revenue.
Together these models to roughly four times return on the engagement, with payback inside the first corrected centre in each district.
It took us 12+ months to build this network, and with this intelligence
we could've built it in 2 months.
The model was back-tested on their own network before it recommended anything. Showing a field team that the model identified centres they already knew were struggling earns more trust than an accuracy claim about markets they have never seen.