A microfinance lender chose centre locations on demographics alone. Adding credit bureau history showed that markets which look identical on paper can differ sharply on write-offs.
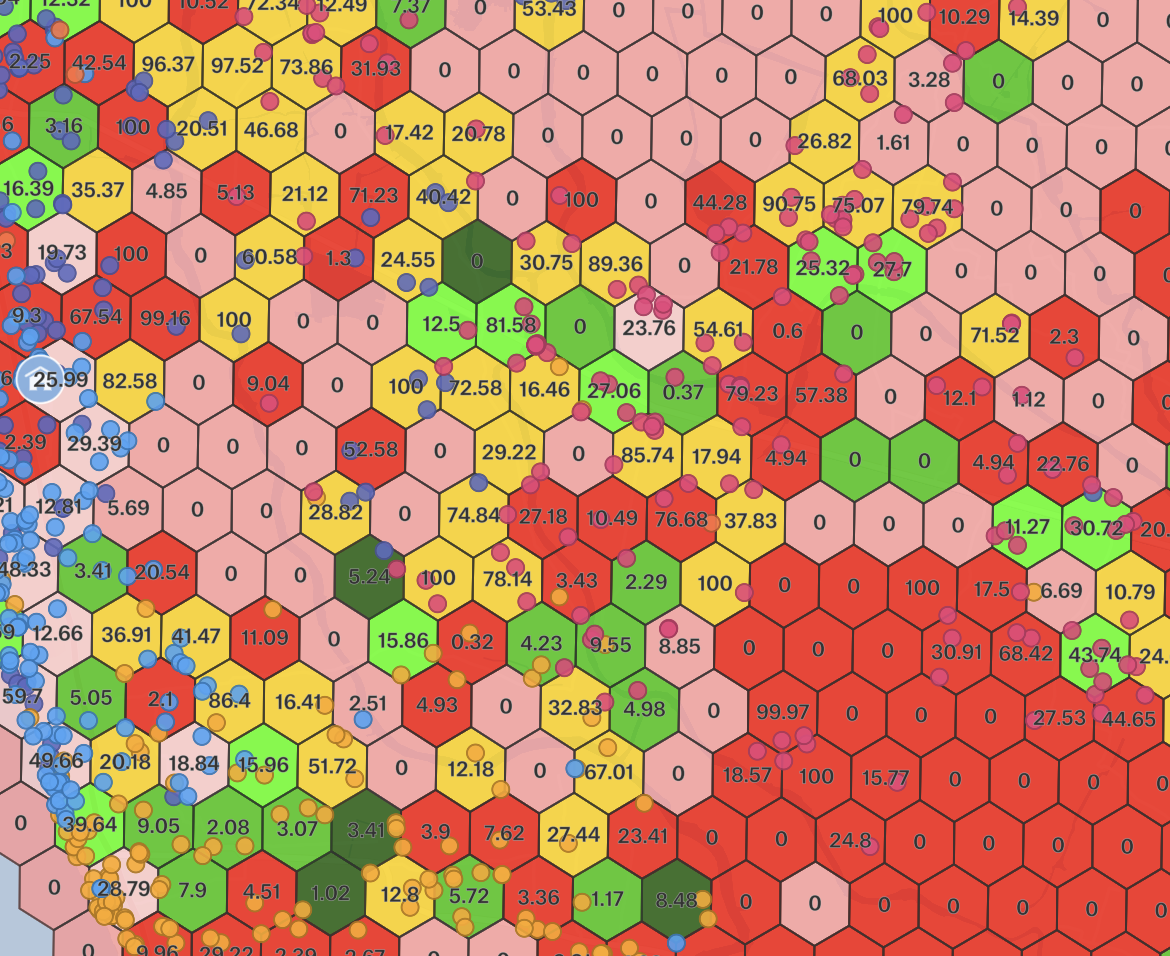
Two villages in the same region, compared on demographics and then on credit history.
Sourcing filters applied to the known customer base returned fewer names each cycle, with no visibility into open market.
Annual targets climbed faster than a centre formation process built on local familiarity could reliably serve.
Write-off behaviour was understood as a portfolio number, which hides the fact that it concentrates geographically.
Both villages are densely populated, commercially active, and hold no customers of the lender. On a population heatmap they are the same recommendation. The bureau overlay separates them completely.
Six dimensions per micro-market, each with a defined threshold rather than a judgement call.
Residential density measured against the state median for population and buildings.
Principal outstanding per capita against the state upper quartile.
Historical write-offs and active defaults at the surrounding postcode level.
The lender's own arrears rate inside the micro-market.
Active customers of the lender inside the cell.
Banks, other lenders and other microfinance institutions inside the 400 metre block.
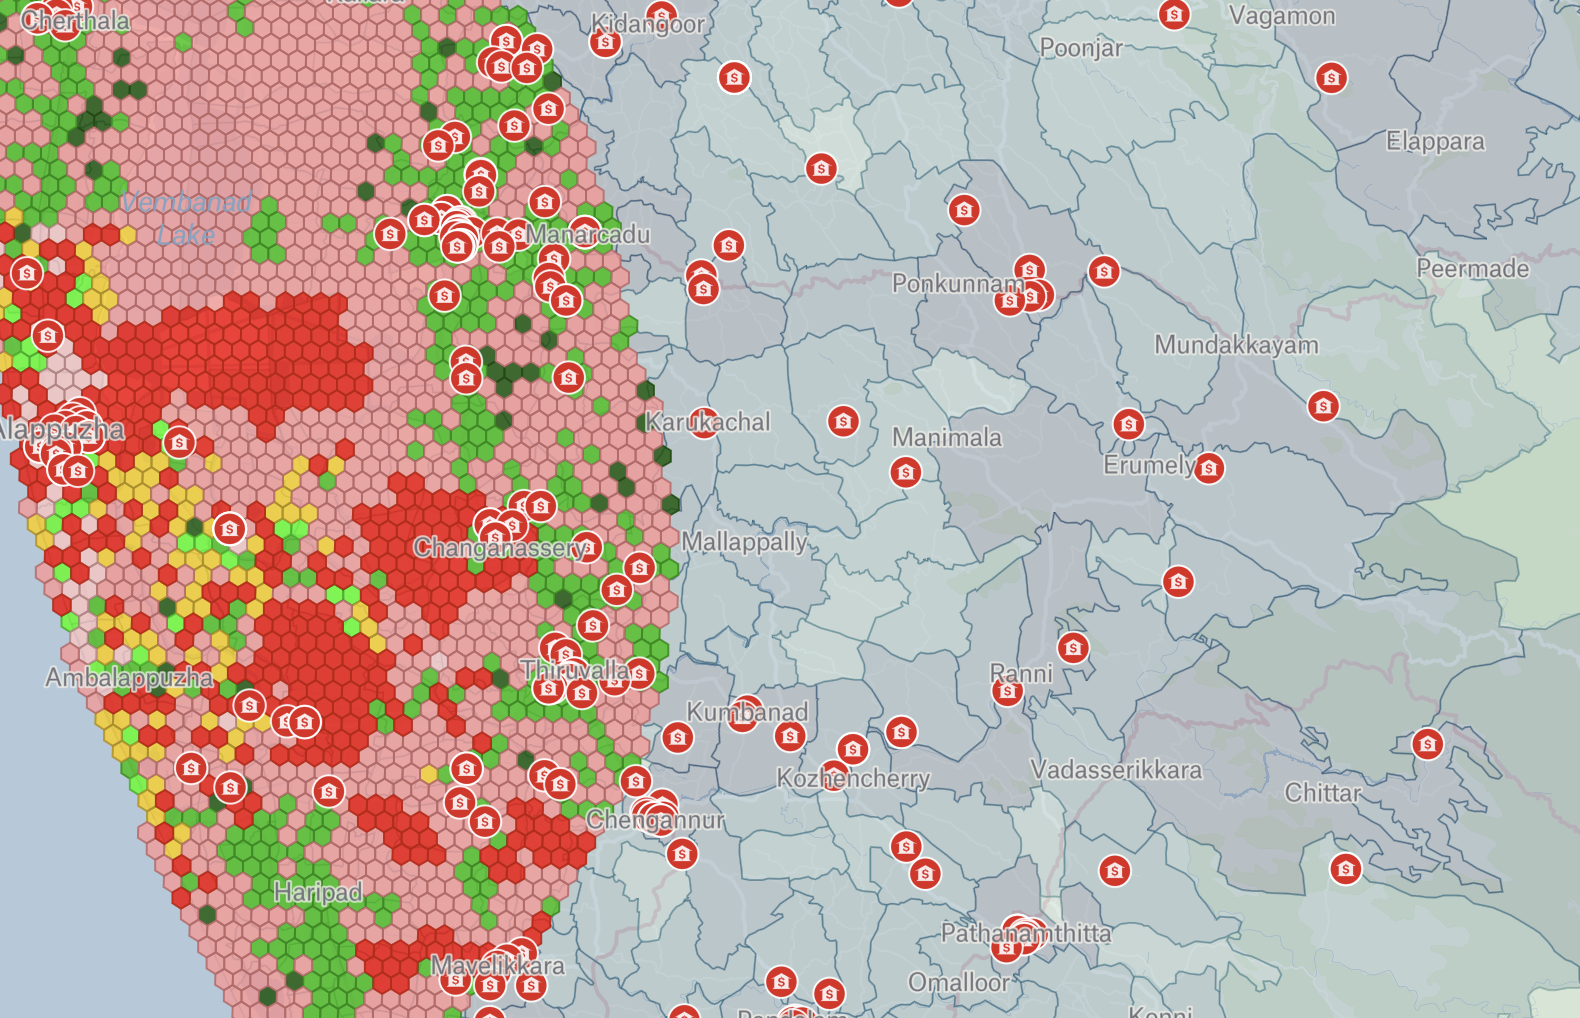
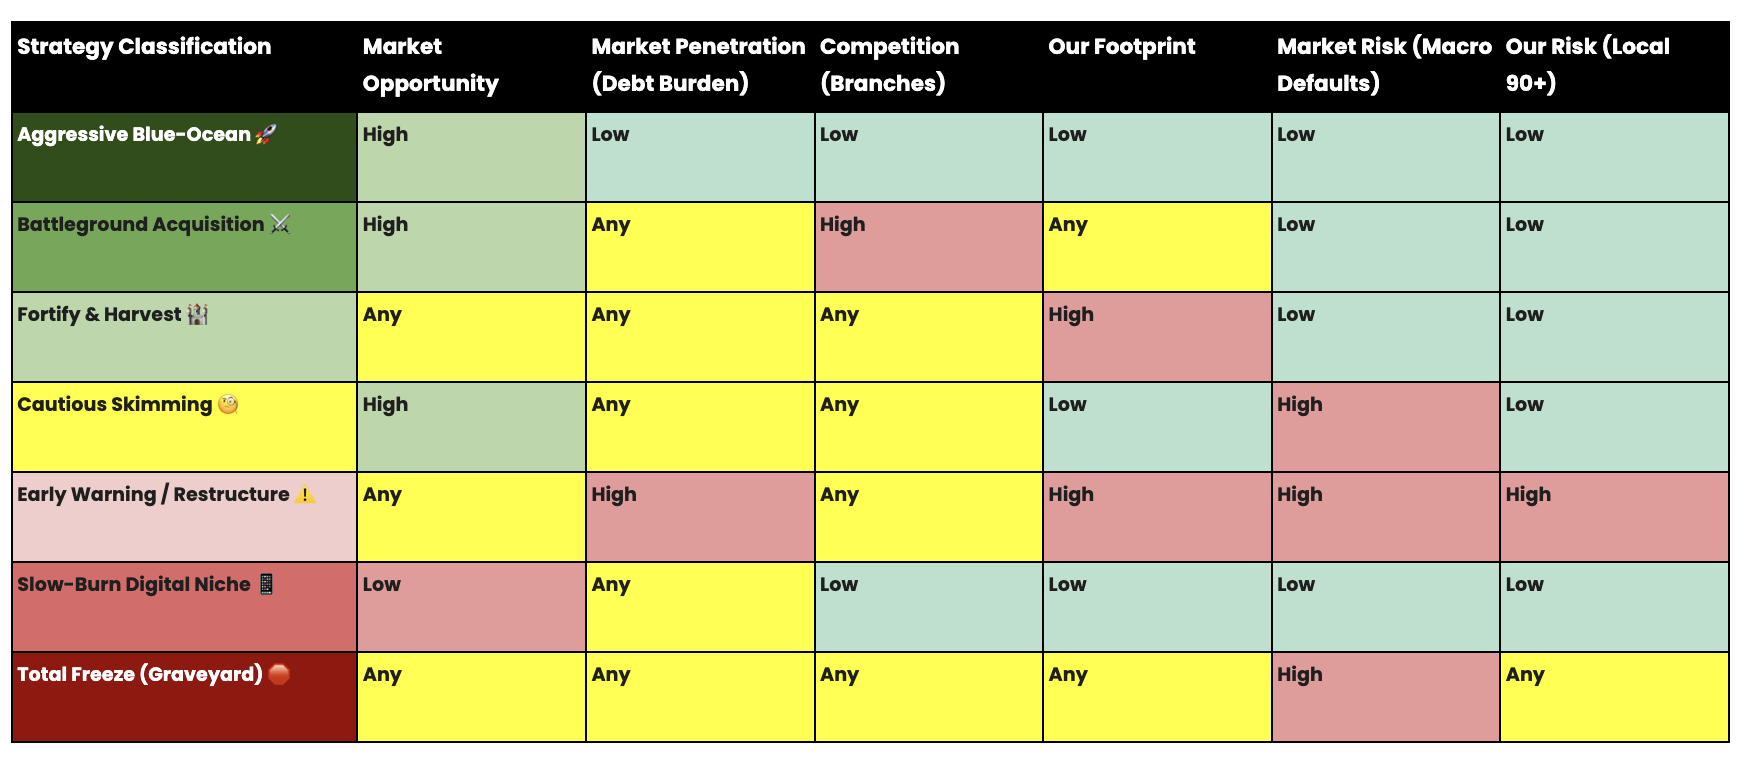
Opportunity, debt burden, risk, footprint and competition combine into a single instruction per micro-market.
Deliverables arriving on different cadences.
A chat interface over the branch data, so leadership can ask a location-grounded question without needing mapping skills or an analyst in the loop.
Hexagons ordered per branch with a go or reconsider flag, so centre formation starts from evidence rather than from where the last centre happened to be.
A hexagon-level risk overlay combining the lender's own arrears with bureau delinquency, naming the markets where new group formation halts.
Three stages, with a decision point that could end it.
A filter applied to a known base can only shrink. The way out is to see the open market, and the reason that had not been done is that open market and unsafe market look the same until credit history is placed on the map.
Name a market your teams walked away from and one they are keen on. We will classify both and show you the credit history underneath the demographics.
Set up a workshopMore Transformation Examples