
Transformation · Banking
Breaking district deposit data down to the branch catchment.
A private bank could see deposit balances by district and nothing below it. We estimated the deposit base around each branch, removed what competitors already hold, and drew territories with goals and market share attached.
Private bank
Branch deposits
Urban and semi-urban
The model, in four numbers
Accuracy is carried from prior deposit engagements. The overlap test is the gate this engagement agreed to before scale-up.
The case
01 · No branch-level share
Two branches, one number
Branches in the same district appear identical in published deposit data, whether they hold a fifth of the market or a twentieth.
02 · Invisible boundaries
Nobody could size the catchment
Without spatial decomposition a branch manager cannot tell whether untapped deposit sits two kilometres away or twelve.
03 · Uneven competition
Rivals do not spread evenly
Competitor density varies block by block, and smaller markets sit furthest from the district average.
Four steps from a district total to a branch catchment
The published district figure is the anchor. Everything below it is estimated, then reduced by what rivals absorb.
01
Ingest
Published district deposit balances across savings, current and term set the addressable pool.
02
Decompose
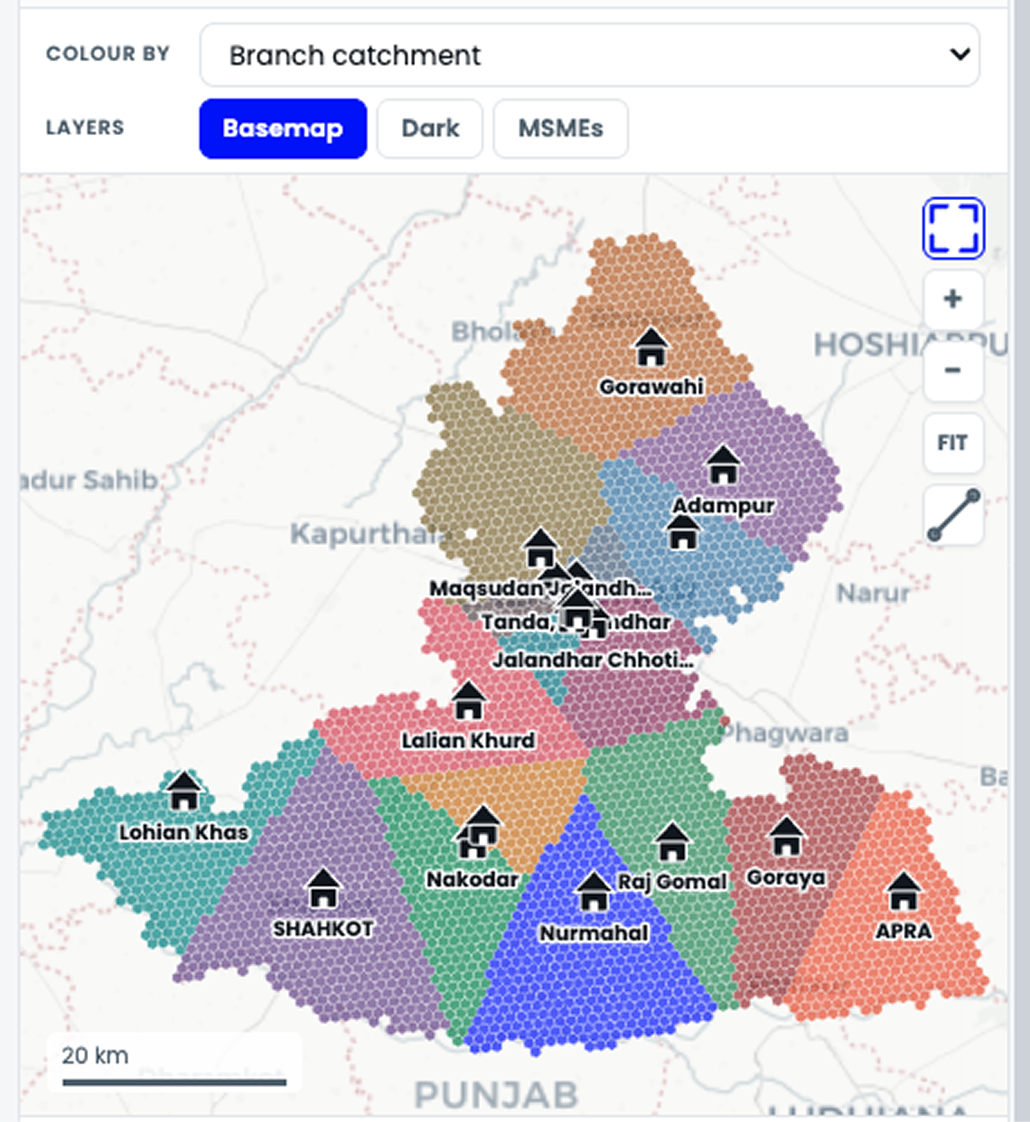
The total is distributed across hexagons using population, vibrance, business density and formalisation.
03
Assign
Hexagons join to branch catchment polygons on the spatial index the bank already uses.
04
Net off
Competitor branches are modelled as gravity wells. What remains is net addressable potential per hexagon.
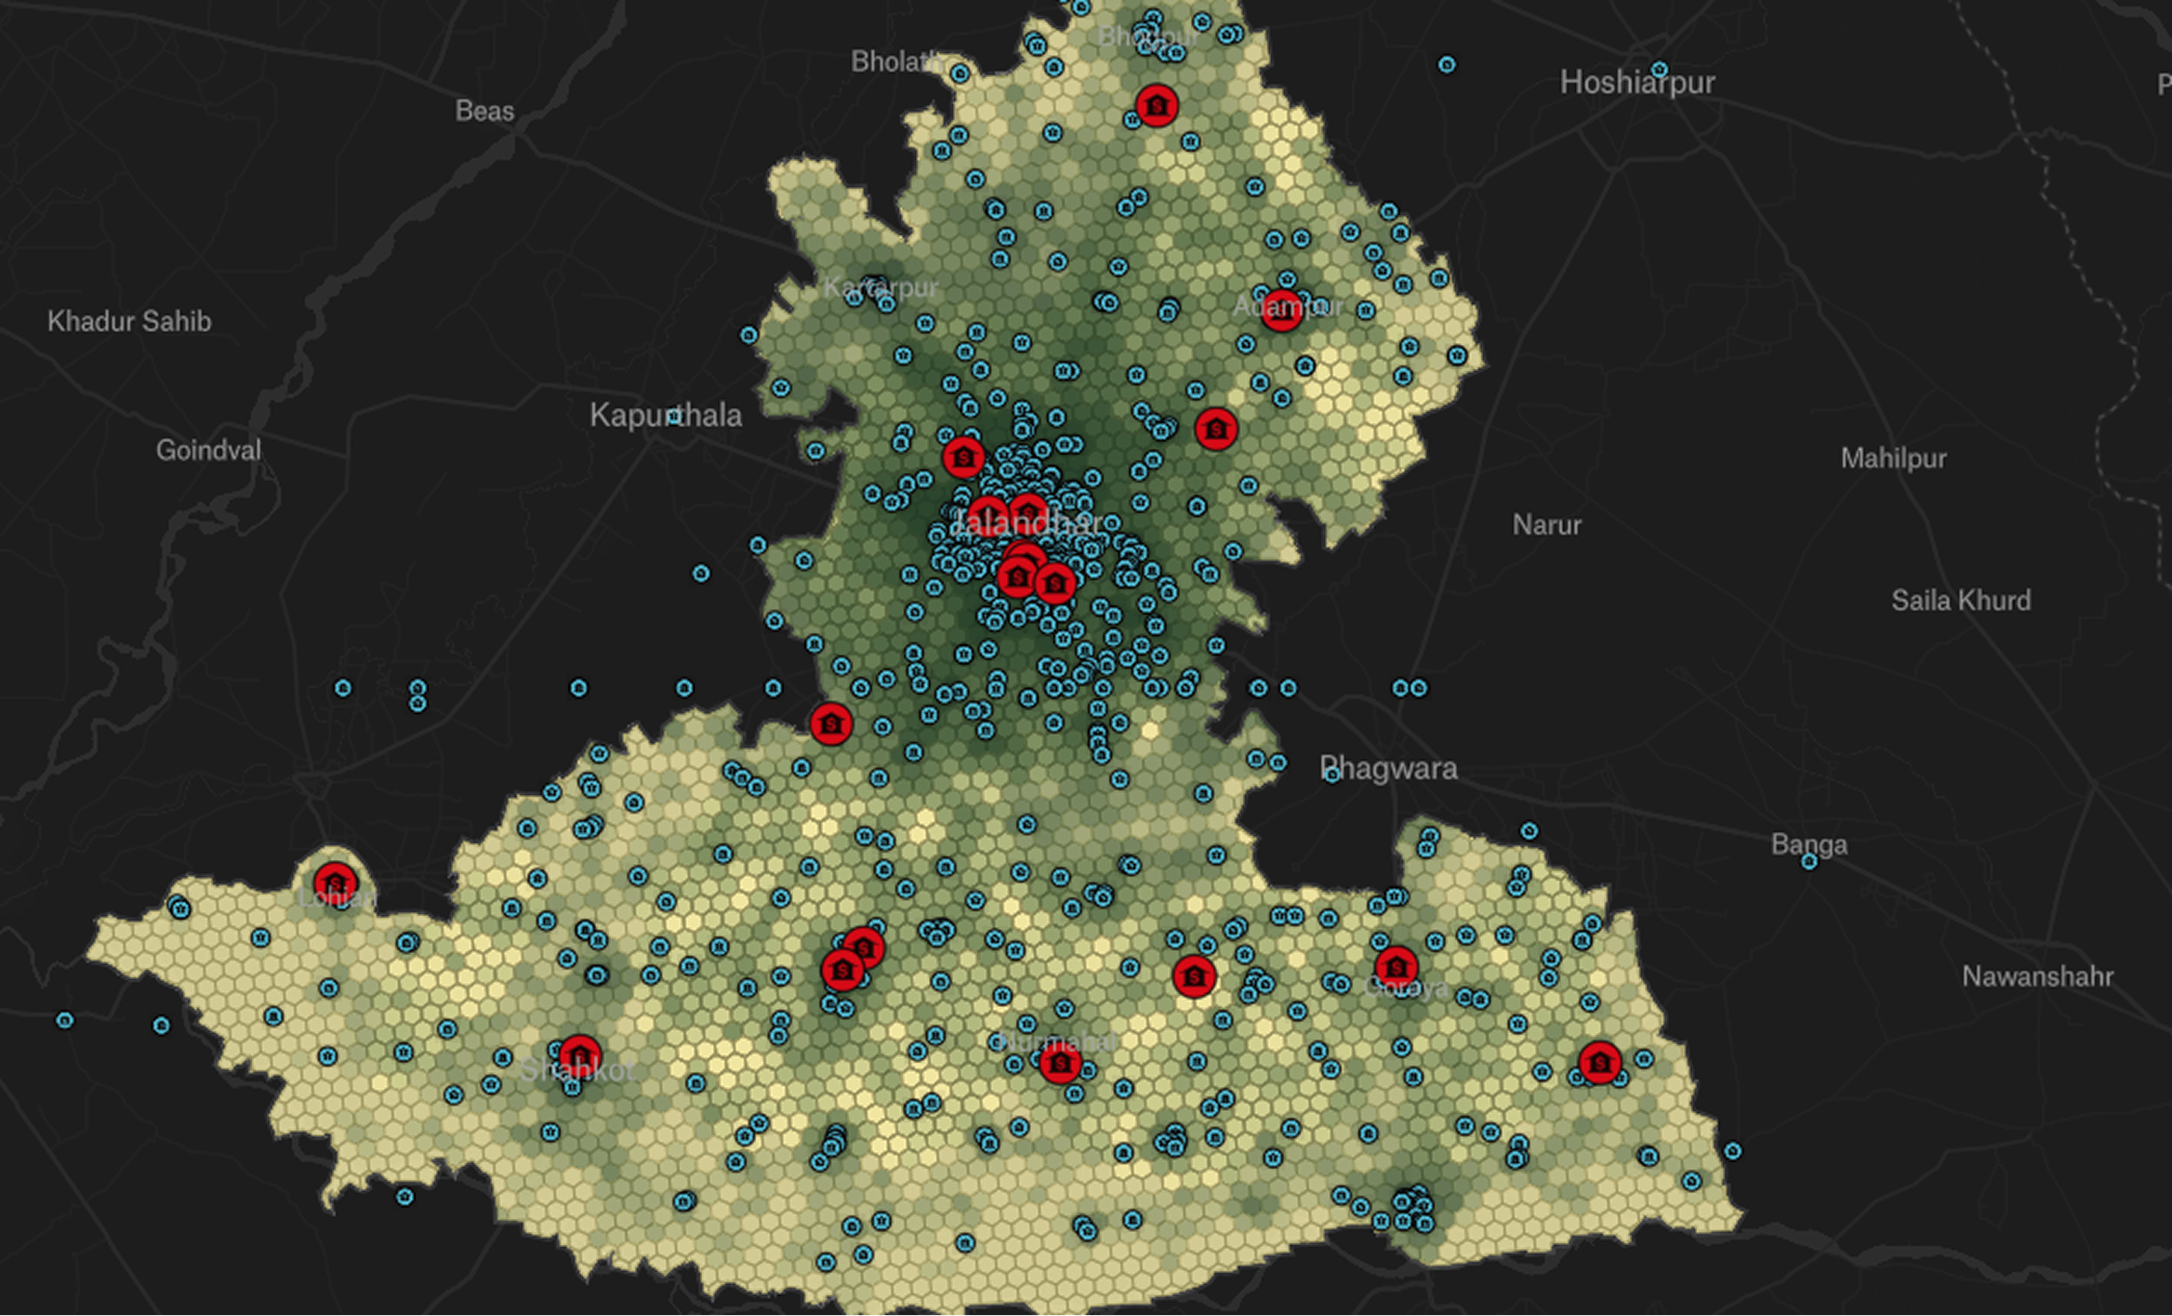
What arrives per hexagon
One row per hexagon, delivered as a flat file that joins to the bank's own branch table on the spatial index.
Field
What it carries
How it is used
Deposit potential
Estimated total addressable deposit in the hexagon.
Aggregate to catchment for branch-level addressable market
Savings, current, term split
The estimate broken into its three components.
Point commercial branches at current account density
Catchment ring
Distance band from the nearest branch counter.
Separate walk-in potential from outreach potential
Nearest competitor tier
Classification of the closest rival branch.
Set the competitive response for the zone
Vibrance and population scores
Economic activity and density indices.
Filter out hexagons too thin to justify field cost
Market tier flag
Whether the hexagon runs the semi-urban and ruralmodel.
Apply the scoring weights that market needs
Semi-urban and rural hexagons run a separate model. Formalisation and road access carry higher weights there, because deposit acquisition works differently in those markets.
Every hexagon carries a class
Potential and competition together decide the instruction.
Class
What it means
Action
Blue Ocean
Strong potential, weak competitor absorption.
Deploy first
Battleground
Strong potential, strong rivals present.
Contest on service and rate
Fortify
Existing share concentrated here.
Defend against leakage
Caution
Potential present, structural risk elevated.
Enter with limits
Graveyard
Neither potential nor headroom.
Remove from field plans
What each team received
One output per role, and a file the data team can join without a new system.
Leadership
Like-for-like branch comparison
Urban and semi-urban branches compared on estimated potential against actual performance, so a small branch in a thin market stops looking like an underperformer.
Branch heads
A catchment insight pack
Total addressable deposit in the catchment, how much sits in each distance ring, and which product the composition calls for.
Data team
A joinable flat file
One row per hexagon keyed on the spatial index, delivered as parquet or CSV so it lands in the bank's existing platform rather than a separate tool.
How the workflow changed
Before
Deposit potential known only at district level
Branch performance judged without a market denominator
Catchment boundaries assumed rather than measured
Competitor pressure treated as uniform across a district
Semi-urban branches scored on urban assumptions

After
Potential estimated for every hexagon in the catchment
Performance read against estimated addressable market
Catchments drawn from distance rings and competitor pull
Competitor absorption modelled branch by branch
Semi-urban and rural hexagons run their own model
How the model gets checked
A blind test, designed before the pilot ran.
Pilot
The model runs across five to ten branches and produces ranked hexagons.
Blind
Test
EPIC's top-decile hexagons are compared against the bank's own deposit-dense customer locations, which EPIC has not seen.
GATE
Overlap between the two sets.
>70%
Decision
Clearing the gate opens the scale conversation. Missing it ends the engagement.
Branch performance is varied drastically. Are we doing badly in a good market? How should we staff each branch? What should be their goals? Are we missing some areas? How do we increase Current Accounts?
Test it blind on five branches.
Share branch locations and aggregated deposit performance.
We will rank the hexagons, and you can check our top decile against customer locations we never saw.
EPIC Intelligence · Client identity withheld