A company sourcing from farmer producer organisations needed to know which could hold a long-term supply contract. Every organisation in the states in scope was assessed on governance, growth, processing access, land and climate, with adverse findings called out.
The engagement produced a ranked recommendation. Contracts against it have not yet run, so these are analysis figures rather than realised outcomes.
Partners were chosen because field teams knew them. Capable organisations outside that circle were never considered.
What an organisation said about itself was the assessment. Nothing independent checked it before a contract was signed.
Multi-year supply arrangements assumed stable land and climate. Both are now moving, and neither was being measured.
Each stage removed organisations for a stated reason. The final tier is the recommendation: organisations that score in the top decile overall, rank in the top third on governance, and have processing within reach.
The recommended tier is not a list of the biggest or best-known organisations. Three of the 659 carry an independently verified adverse finding, and the model surfaces them by name rather than burying them in an average. A buyer sees exactly which three to examine before signing.
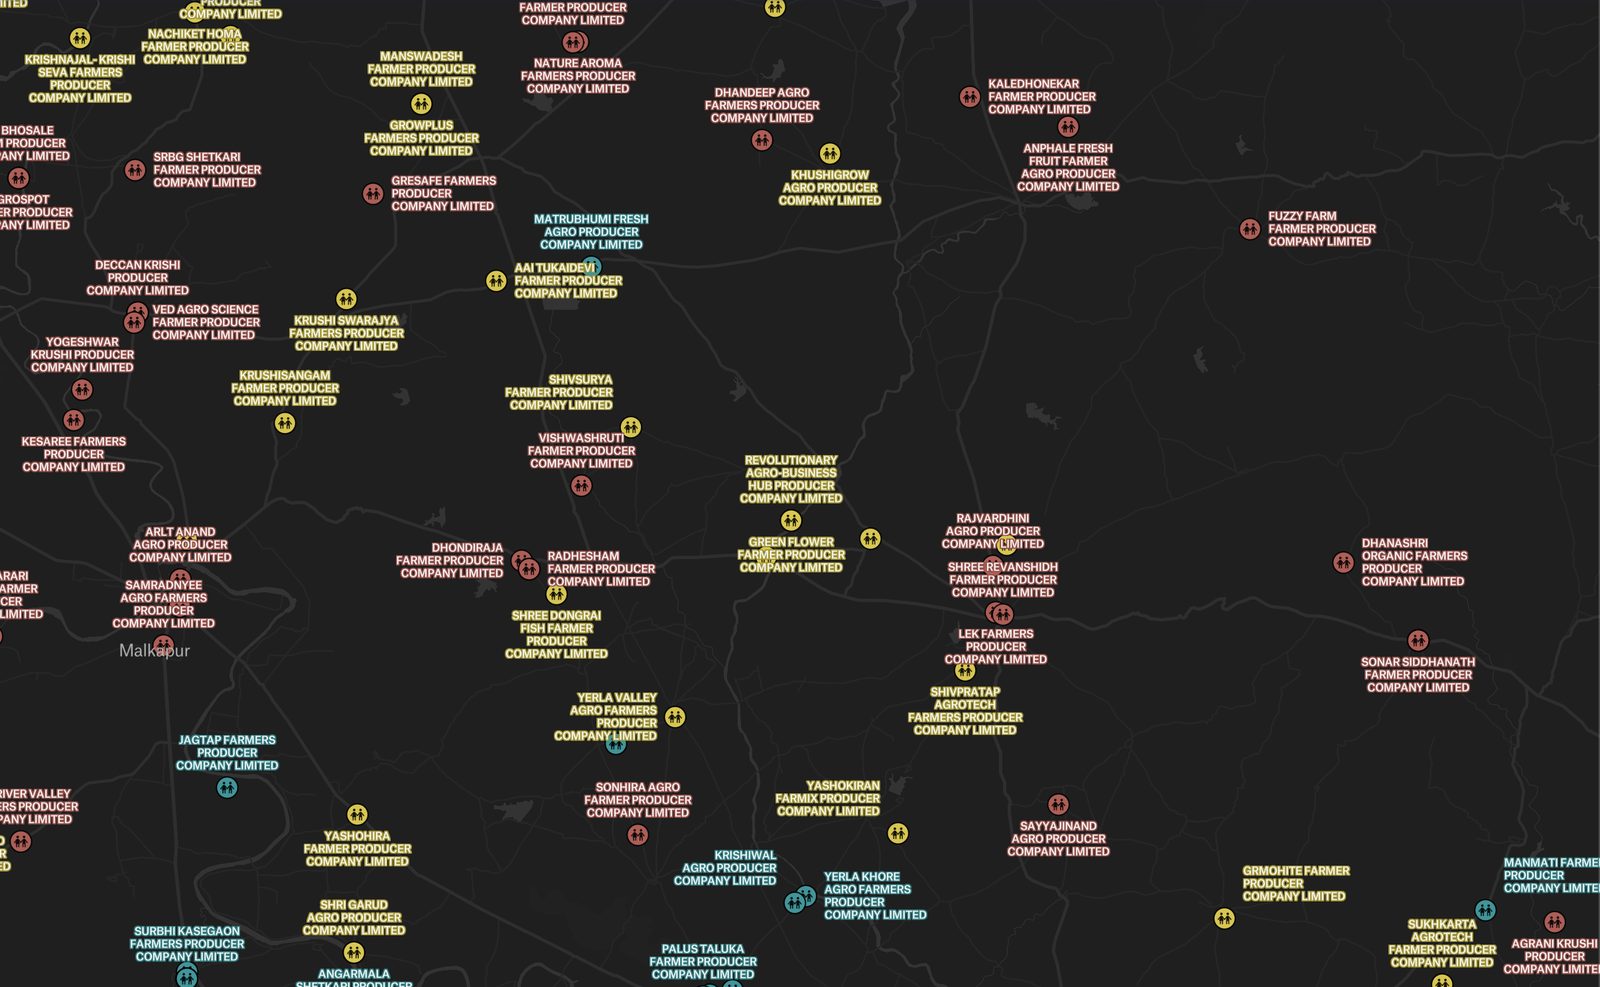
Every organisation in the tier can be inspected on all five dimensions, compared to its district peers, and traced to the sources behind each score. Ten are shown below, chosen for spread rather than rank: ten districts, all three states, and scores from the top of the tier to its lower bound. Several carry one clearly weak dimension. That is the point of scoring five things separately.
Each organisation was scored on five dimensions from 76 inputs reconciled across 18 sources: corporate registries, satellite observation, village infrastructure surveys, government scheme records and independent web verification. An organisation had to score reasonably on every dimension. Excellence on one could not conceal weakness on another.
External assessment grades, board structure, institutional backing, and how much authorised capital has been called up.
Scale relative to age, organisational build-out, and recorded trading and credit activity.
Processing enterprises, warehouses and extension services within a five-kilometre radius.
Satellite vegetation health, cropland extent and its direction of travel, irrigation access and soil testing reach.
Drought intensity and history, agricultural stress, and the direction of climate trend at each location.
Web-grounded confirmation of scheme participation, market listings, digital presence and adverse findings, applied across the dimensions above.
Every organisation is placed in a tier with an action attached. Thresholds are computed from the population rather than fixed, so a buyer and a lender can each redefine what strong means and see the tiers redraw.
The recommendation ships as a queryable system rather than a spreadsheet. Each team asks in plain language and gets an answer drawn from live data.
The recommended tier, filterable by state and district, with concentration risk assessed across the set so a single regional shock cannot take out the supply base.
Full stack rank with every dimension visible. Peer comparison within district. Similarity search to find organisations resembling a partner that already delivers.
Per-organisation profiles in plain language showing the strongest dimension, the weakest, and which claims are independently verified versus self-reported, so a visit confirms rather than discovers.
Three things a long-term contract depends on, and how the recommendation is designed to improve each. These become measured outcomes once contracts run against the shortlist.
Each of these is a claim about design, not yet about results. We publish the mechanism and the measure, and we will publish the figure when the first contracts have run long enough to produce one.
Because size tells you how many farmers an organisation has, not whether it can hold a contract. We tested it. Farmer count barely moves with contract readiness, a correlation of 0.12. Take the 659 organisations with the most farmers and only 84 make the recommended tier. The other 87 percent fall short on something a contract depends on. Of those 659 largest organisations, 425 score below 40 on at least one of governance, processing access, land or climate. A big farmer base sitting on shrinking cropland, or with no processing within reach, or with a board that cannot govern it, is a large risk rather than a large opportunity. The five dimensions exist to tell the difference.
We score one district against the organisations you already work with. You check the model against what you know before it goes near a decision.
Score one districtMore Transformation Examples