
Case Study · Life Insurance
Where to place the next agent, decided before recruiting starts.
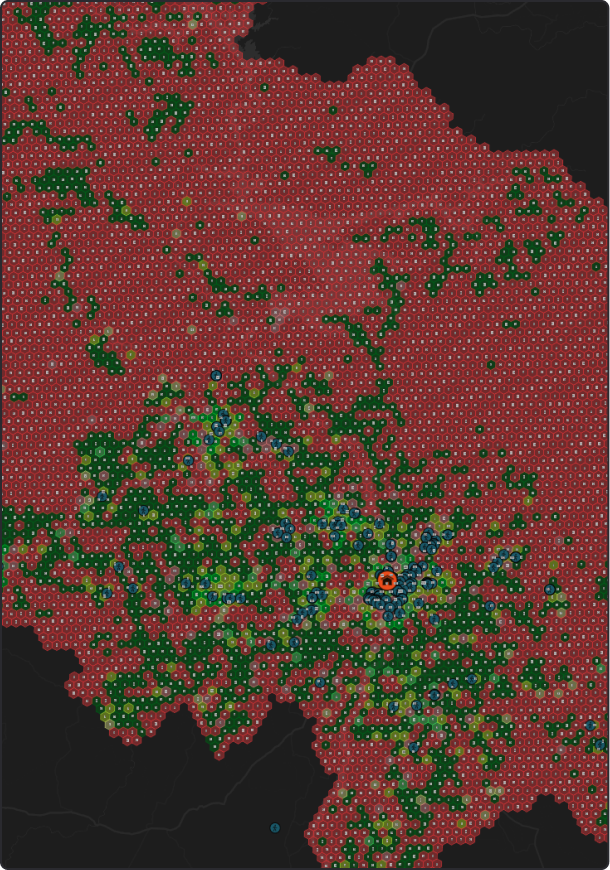
One of India's largest life insurers was expanding its agency channel across Tier 3–5 markets without a view of which micro-markets to enter. EPIC classified every market in the footprint into five growth zones, and surfaced the policyholder clusters sitting beyond reach of any agent.
Large life insurer
Agency channel
Tier 3–5 markets
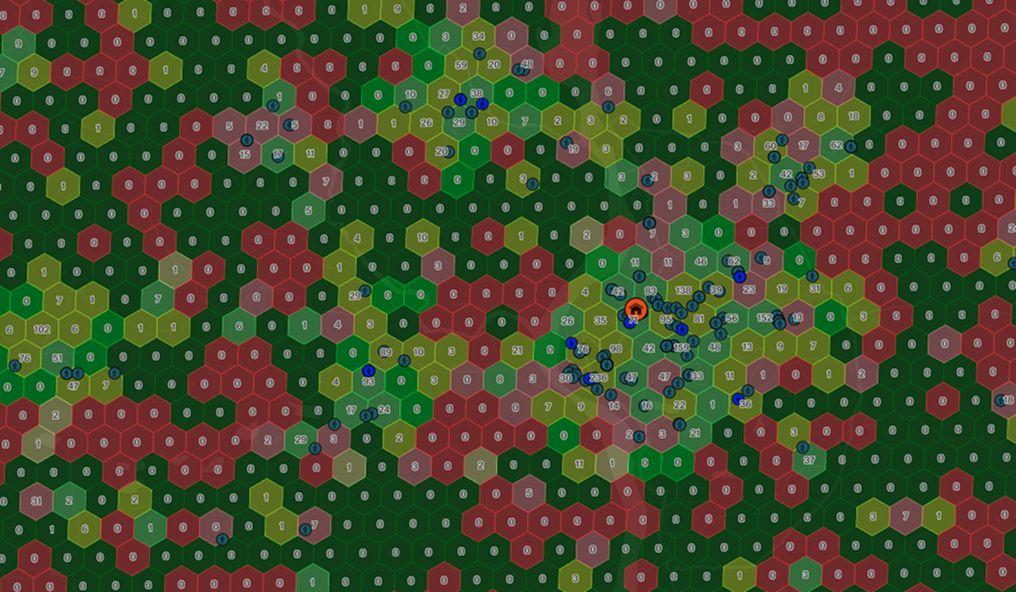
Every market classified
One of five growth classifications applied across the entire agency footprint.
Scouting replaced
Manual market scouting per Unit Manager, replaced with aready brief.
Ramp time recovered
Agents placed in identified white space reach productivity sooner.
Service gaps surfaced
Dense policy holder clusters with no agent within servicing range.
The situation
The agency channel is this insurer's largest distribution engine, and the next phase of growth sits in Tier 2–5 markets. Getting advisors into the right places ahead of competitors is the whole game.
Unit Managers were being directed to recruit, but given no view of which villages, PIN codes or micro-markets to enter. Scouting was manual, three to five days per market, and the quality of the result varied with the individual doing it.
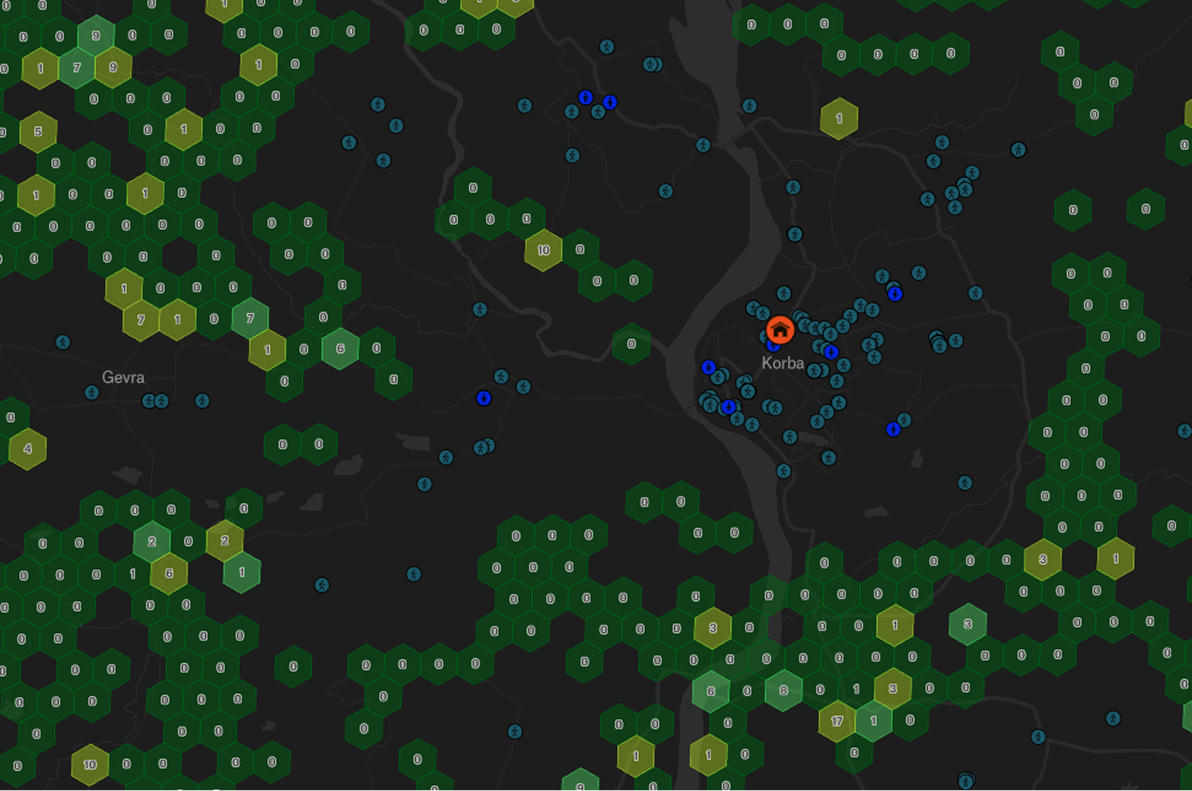
Four gaps between recruitment and opportunity

01
Recruiting without a map
Unit Managers were told to hire, but not where. Target markets were chosen from local familiarity.

02
New agents placed conveniently
Recruits landed in accessible geographies rather than high-opportunity ones. Ramp time was lost from day one.

03
Active agents beside untapped markets
Productive advisors were working exhausted micro-markets while high-opportunity clusters sat adjacent, unnoticed.

04
Policyholders beyond reach
Customers living far from anyactive agent received little servicing. Lapse rates followed.
Why a population map isn't enough
Three things decide agency performance that a demographic view does not capture.
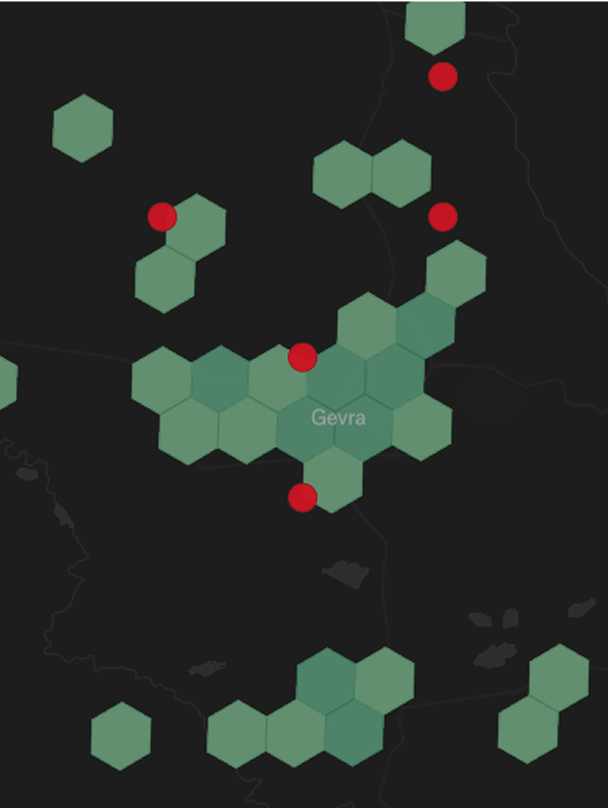
Population is a weak proxy
Two markets of identical size can carry entirelydifferent insurance propensity. Wealth signals,formalisation, MSME density and consumerdurable presence separate them; headcountdoes not.
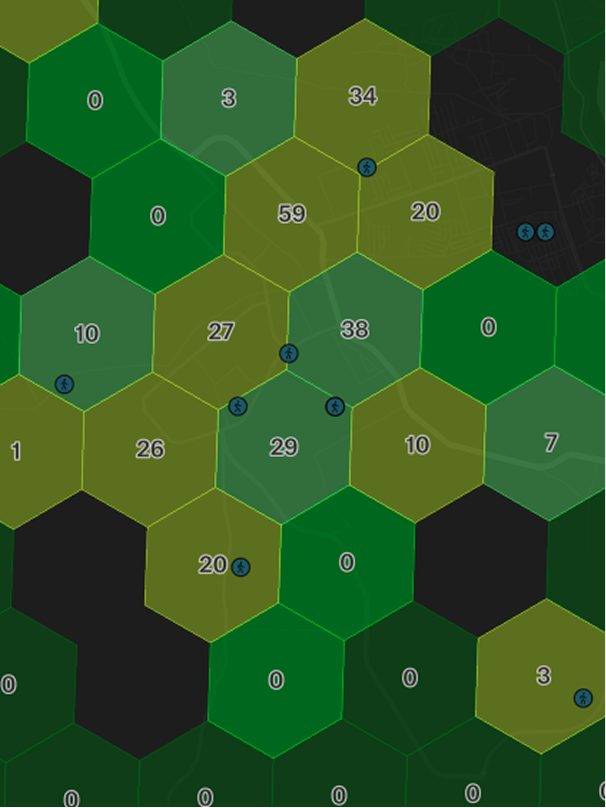
Presence is not penetration
Having agents in a market says nothing abouthow much of it has been captured. Well-covered markets can be exhausted; thinly covered ones can be wide open.
Distance decides retention
Acquisition gets the attention; servicing distance drives the lapses. A policyholder with no agent nearby is a renewal already at risk.
The model was run backwards before it was run forwards
EPIC scored collection centres whose revenue performance was already known. The model separated strong sites from weak ones on data the business already held. Three findings shaped everything after.
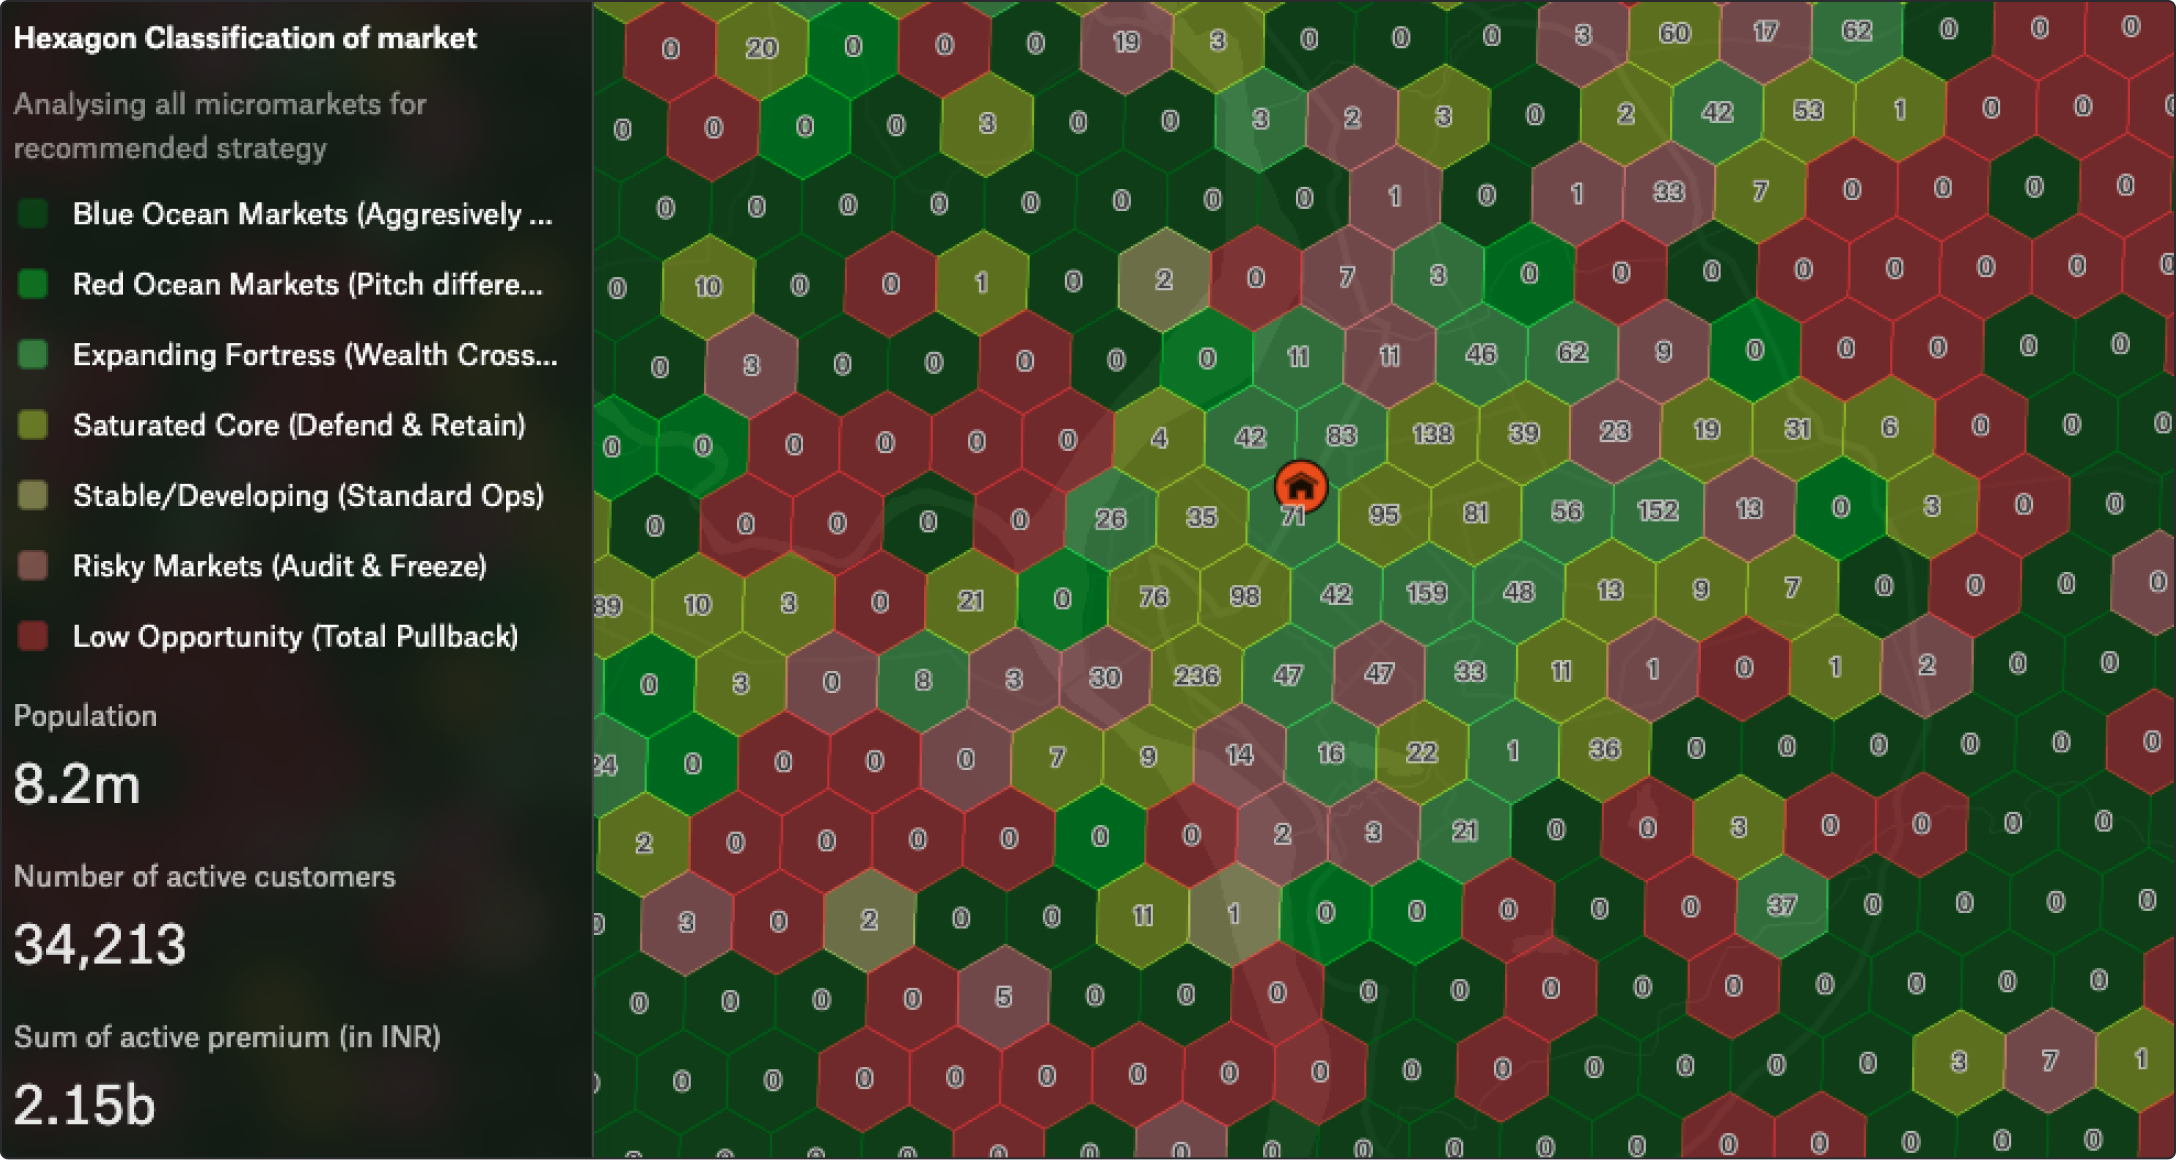
Priority White Space
Zone 01
High opportunity and wealth potential, low market penetration. The market is there; theinsurer isn't.
Action
Recruit here first
High Yield Markets
Zone 02
Strong existing presence with proven agent productivity and growing revenue.
Action
Protect and deepen
Stable Markets
Zone 03
Well-penetrated territories with steady renewals and consistent retention.
Limited headroom.
Action
Maintain, don't over-invest
Quality Review Zones
Zone 04
High policy lapse rates alongside slowing growth. Something is wrong that recruiting will not fix.
Action
Operational branch review
Service-Starved
Catchments
Zone 05
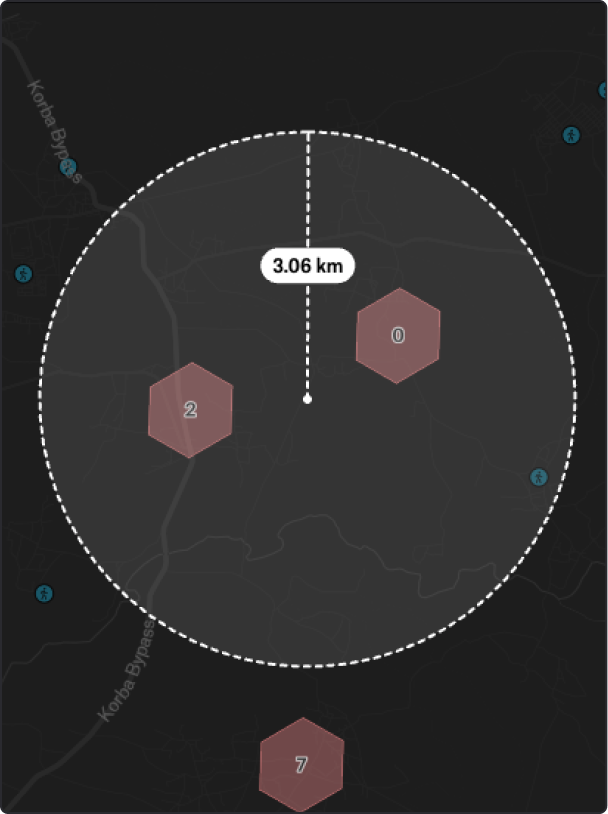
High customer density where the nearest servicing agent is more than five kilometres away.
Action
Recruit locally, into the pocket
The five-kilometre problem
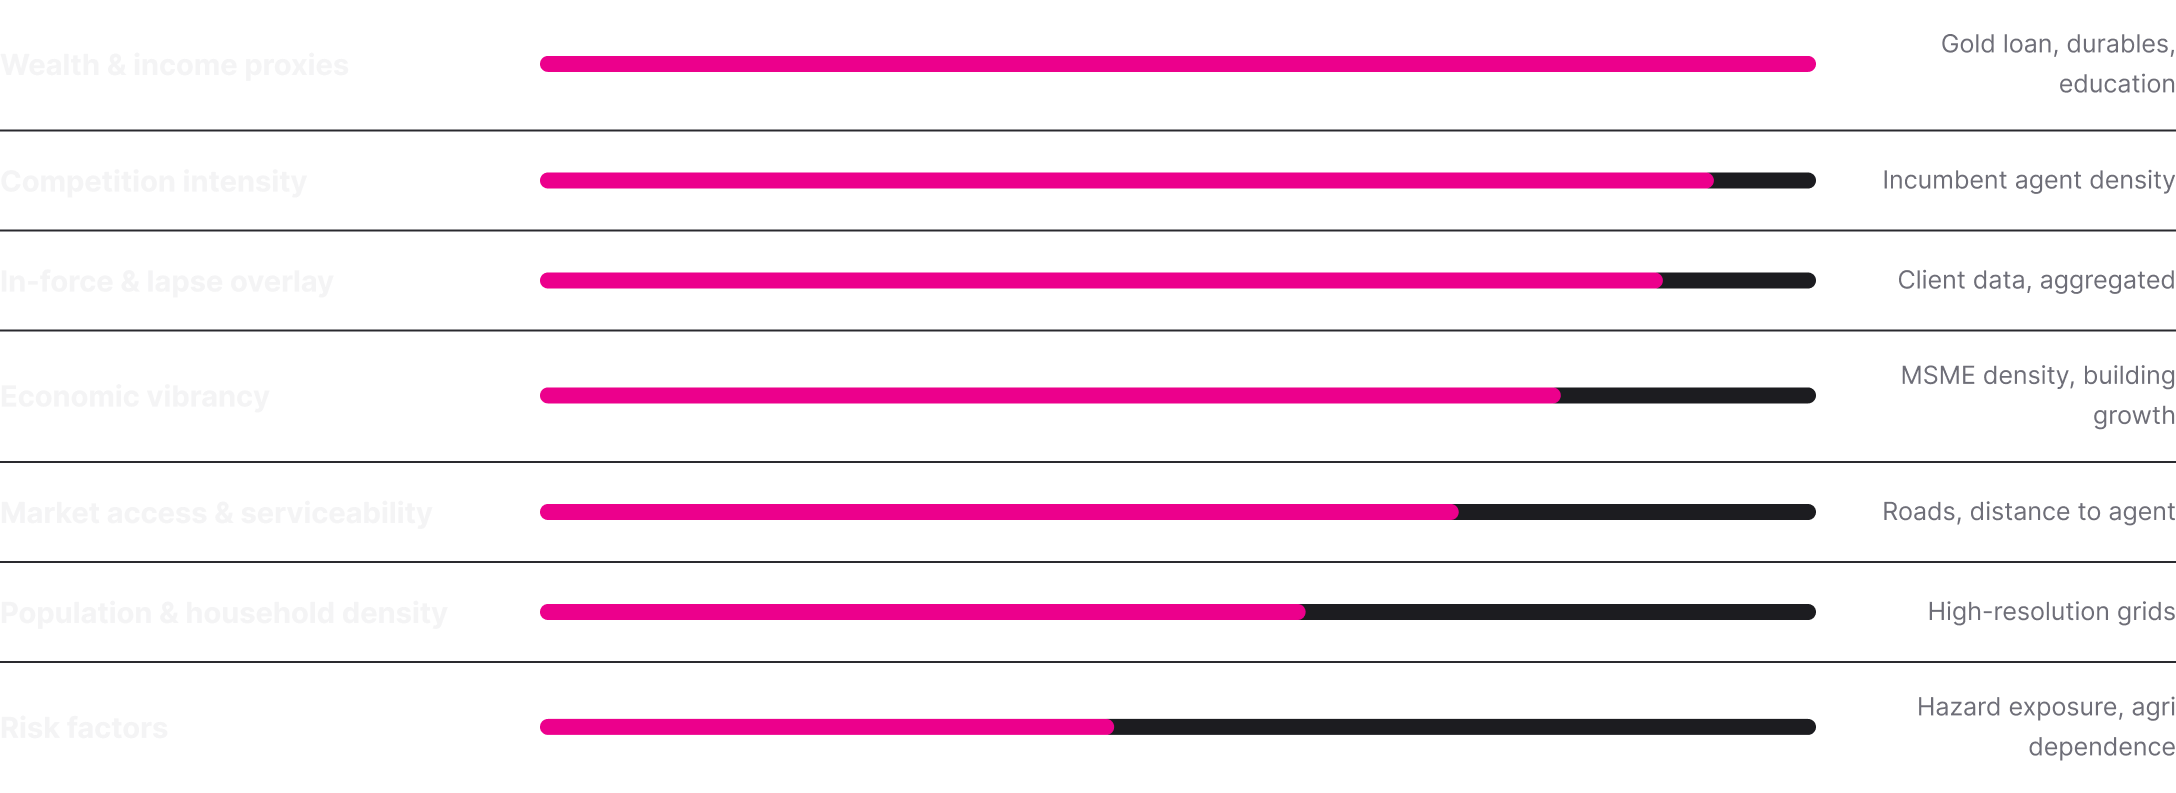
Each 0.7 km² hexagon carries over 100 signals. Four families do most of the work.
Beyond 5 km
No agent in range. Servicing drops away and lapserisk concentrates.
The action
Isolate the cluster, recruit a local advisor directlyinto it.
Within 5 km
Active agent present. Servicing is routine, renewalshold.
What feeds the classification
Public and licensed signals, combined with the insurer's own anonymised portfolio view.
What each team received
One output per role. Field teams get a list, not a map to interpret.
Leadership
A live territory review
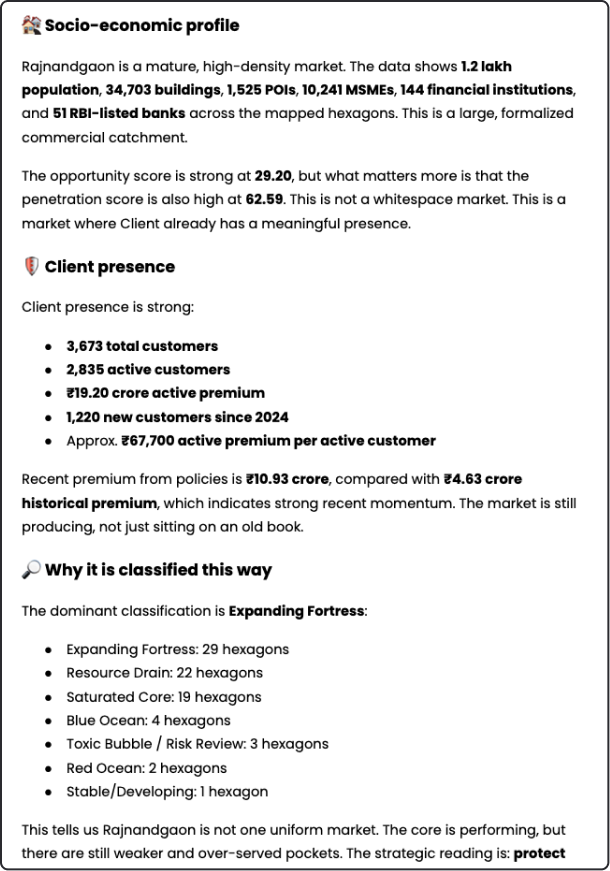
Zone classification across the footprint, withlapse concentration and coverage gaps visible by region, built for monthly territory reviews rather than annual planning.
Unit Managers
A recruitment brief
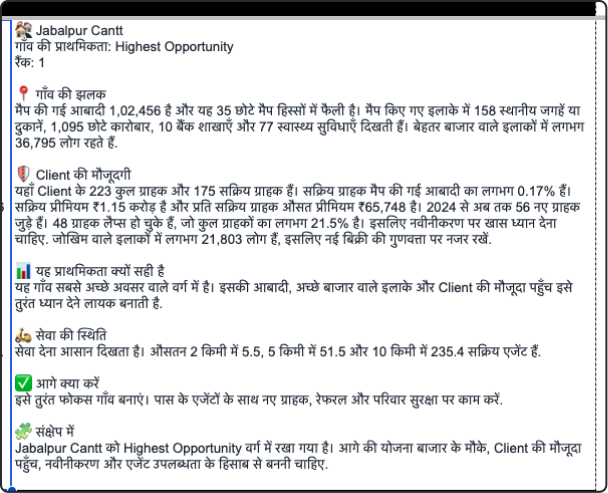
Ranked white-space markets, named prospectbusinesses to approach, and a placement gapmap showing where managers currently sitagainst where the opportunity is.
Field
A filterable list
Named locations at PIN code and village level, filterable on the criteria that matter, for example population above 50,000 with fewer than five agents present. Exportable, not a map to decode.
How the workflow changed
Before
- Unit Managers chose markets from local familiarity
- Three to five days of manual scouting per market
- New agents placed where access was easiest
- Lapse concentration invisible until the renewal missed
- Territory reviews ran on aggregate branch numbers

After
- Markets ranked and classified before recruiting begins
- Scouting replaced by a ready brief with named prospects
- Agents placed into identified white space from day one
- Service-starved catchments surfaced and staffed deliberately
- Reviews run on a live map, at micro-market resolution
How it was built and proven
The classification was built against the insurer's own in-force and lapsedata, so every zone was tested against outcomes the business already recognised. Where the model said a market was exhausted, the renewaldata agreed.
Version one delivers a one-time intelligence snapshot across thefootprint. Version two adds a custom life insurance propensity model calibrated to the agency channel's product mix, with weekly insights.Version three closes the loop between field activity and market intelligence.
How the engagement was held to account
01
Tested against the insurer's own portfolio. Zones were validatedagainst in-force and lapse performance the business already had,not against an external benchmark.
02
Aggregated data only. Portfolio signals were used at market level.No personally identifiable customer information was required orheld.
03
Every recommendation carries its reason. Field teams can seewhy a market ranked, and challenge it on the ground.
"We want this map and ask them to go to the exact specific areaswhere they can recruit more agents, and we want to tell them why,and in the simplest possible format."
— Agency leadership, on the first review of the model
Fair, and it changed the deliverable. The map is a leadership tool. What reaches the field is a filtered,exportable list of named locations with a recruitment target attached to each one, usable on a phone,with no training required.
Run this on one of your regions.
Choose a region you know well. We will classify every market in it, share theoutput, and you can tell us where the model is wrong.
EPIC Intelligence · Client identity withheld · Draft V4 for internal review