One of India's largest white-label ATM operators replaced district-wide scouting with a scored shortlist of specific locations. Validated across two pilot markets, then scaled into the wider network.

ATM economics turn on a few hundred metres. A machine placed beside a mandi clears its transaction threshold; the same machine on the wrong side of the same market does not.
This operator was expanding into semi-urban and rural India, where the transaction case is strongest and reliable data is thinnest. Site selection was entirely field-led: sales teams chose where to look, scouted, and reported back. Headquarters saw a site only after a week of searching had already been spent on it.

Four constraints, none of them about effort.

Teams chose the search area. Leadership reviewed the choice only after scouting was complete.

Every district received equal effort, over-investing in thin markets and under-serving dense ones.

Doubling deployments meant doubling the scouting team. Growth scaled linearly with cost.

Assessment varied by scout. Without a shared score, site quality could not be audited.
Three factors decide ATM viability that a footfall model does not capture. Each was built into the scoring.

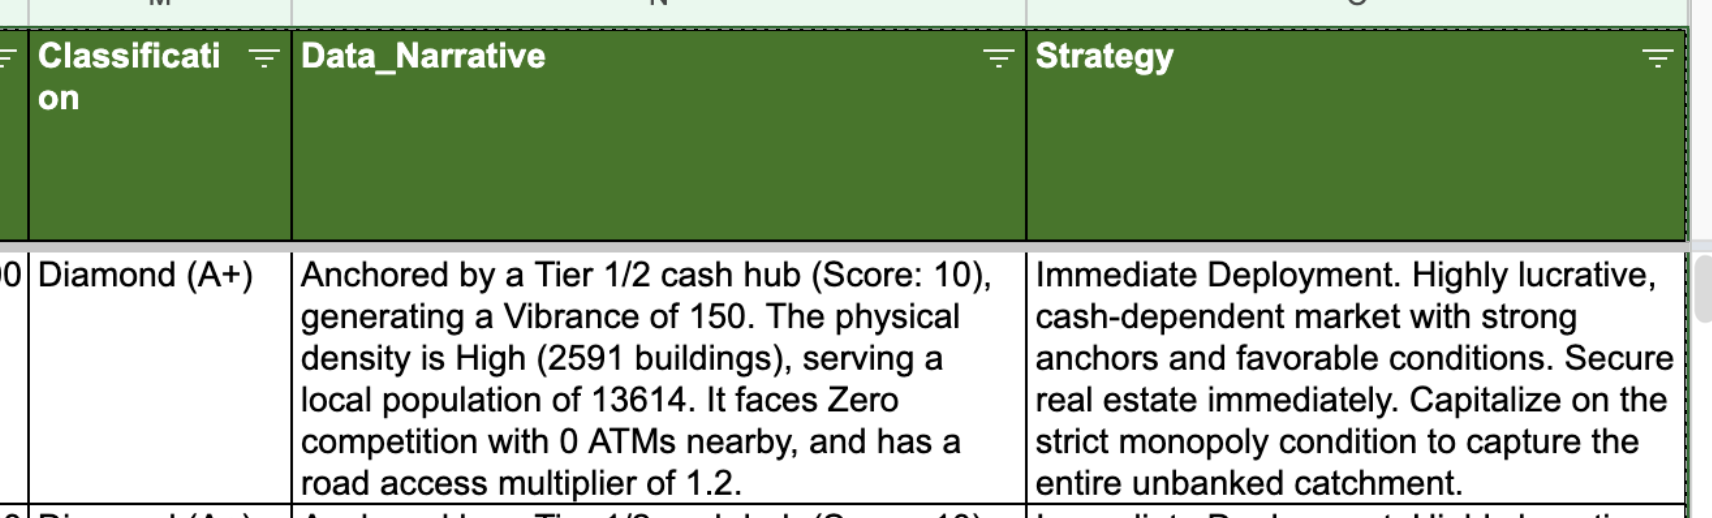
A garment showroom and a mandi can draw identical foot traffic. One settles on UPI, the other in notes. The model weights cash behaviour, not people.

Two machines sharing a catchment do not earn double; they divide it, and both can fall below threshold. Proximity is scored as a penalty.

A high-demand anchor is unusable if the final approach is a footpath. Road access is applied as a multiplier that can zero out an otherwise strong site.
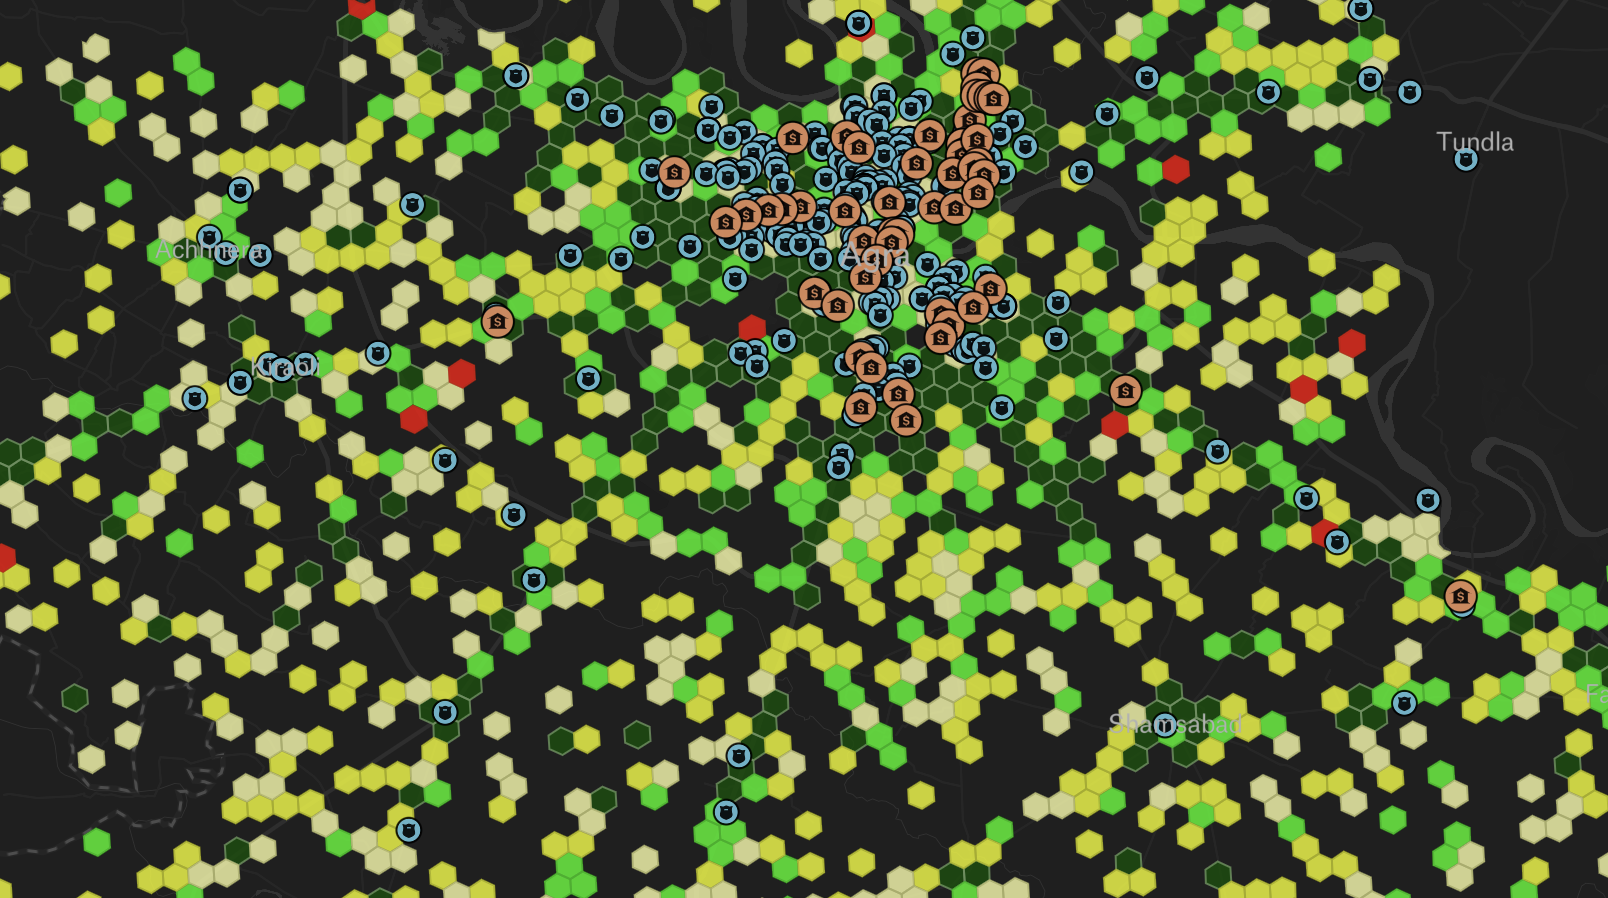
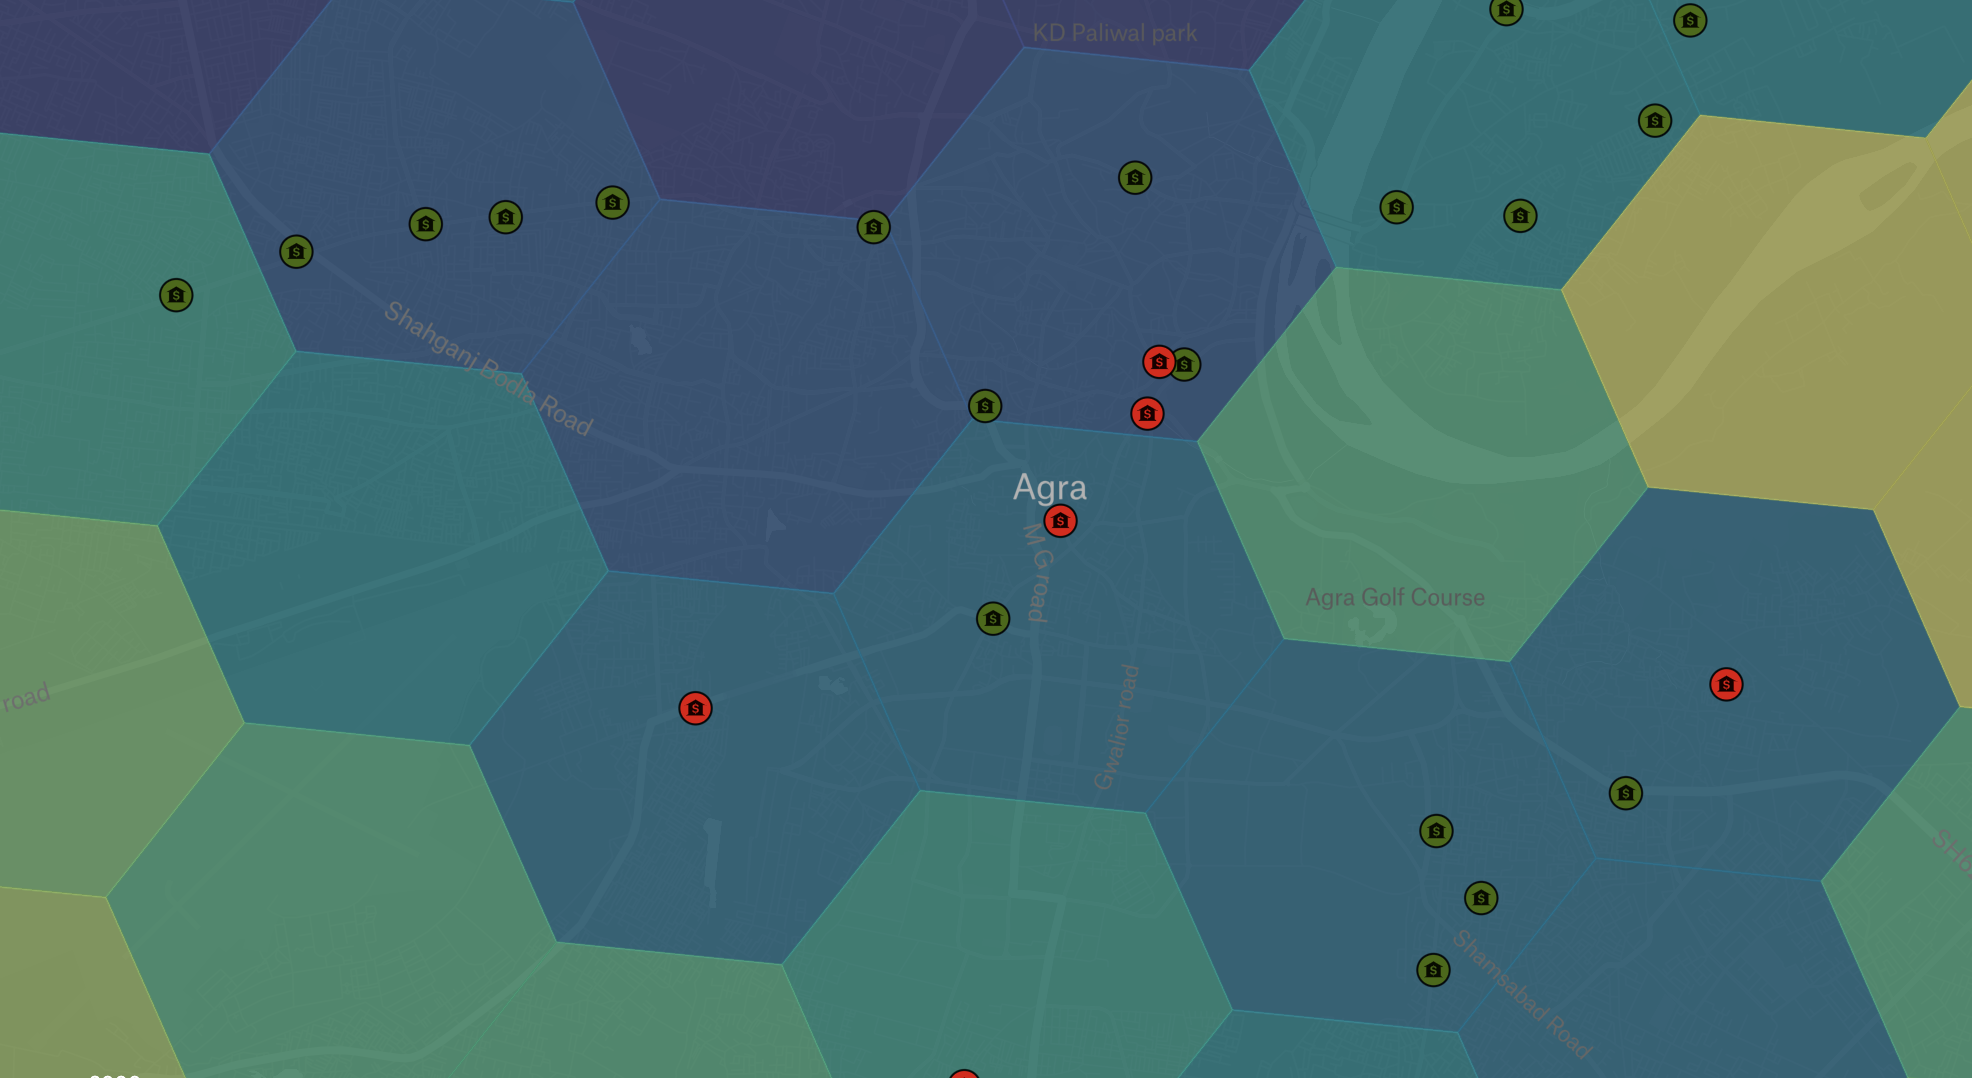
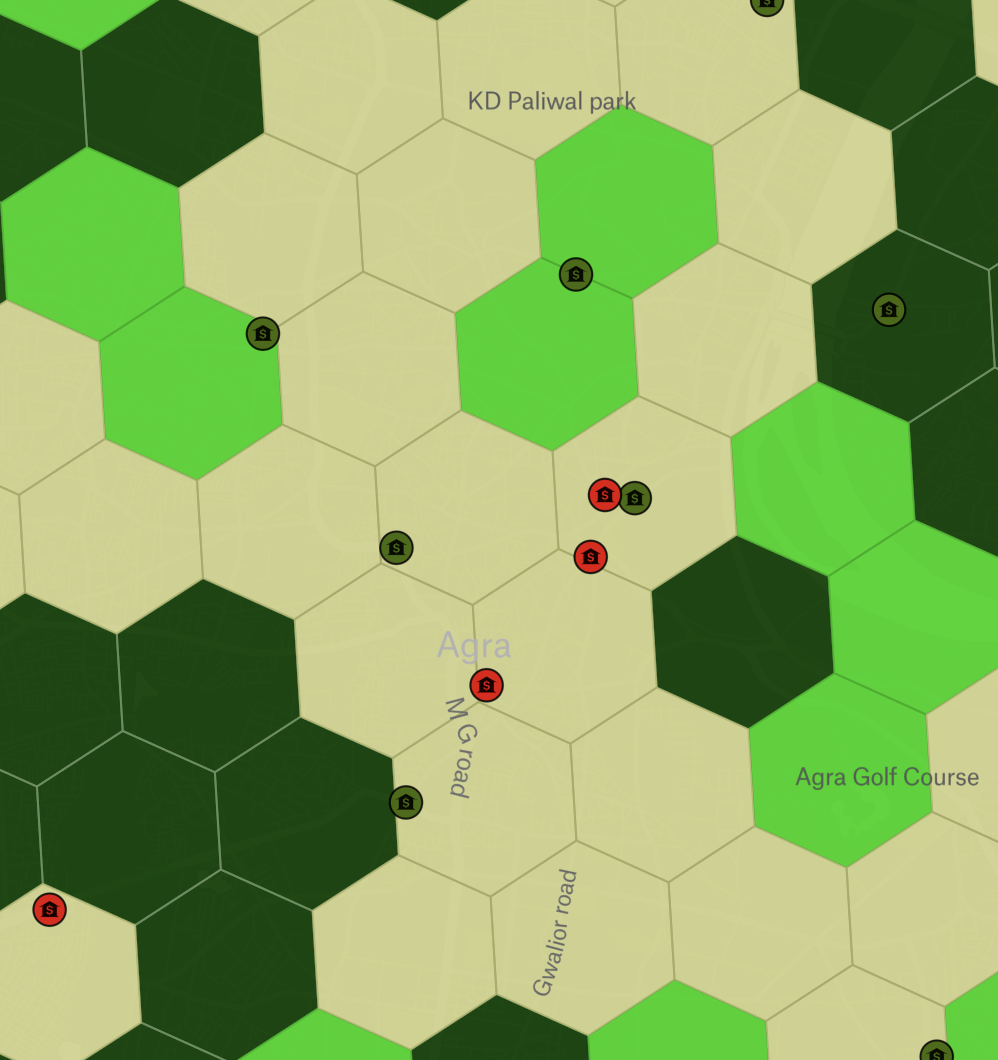
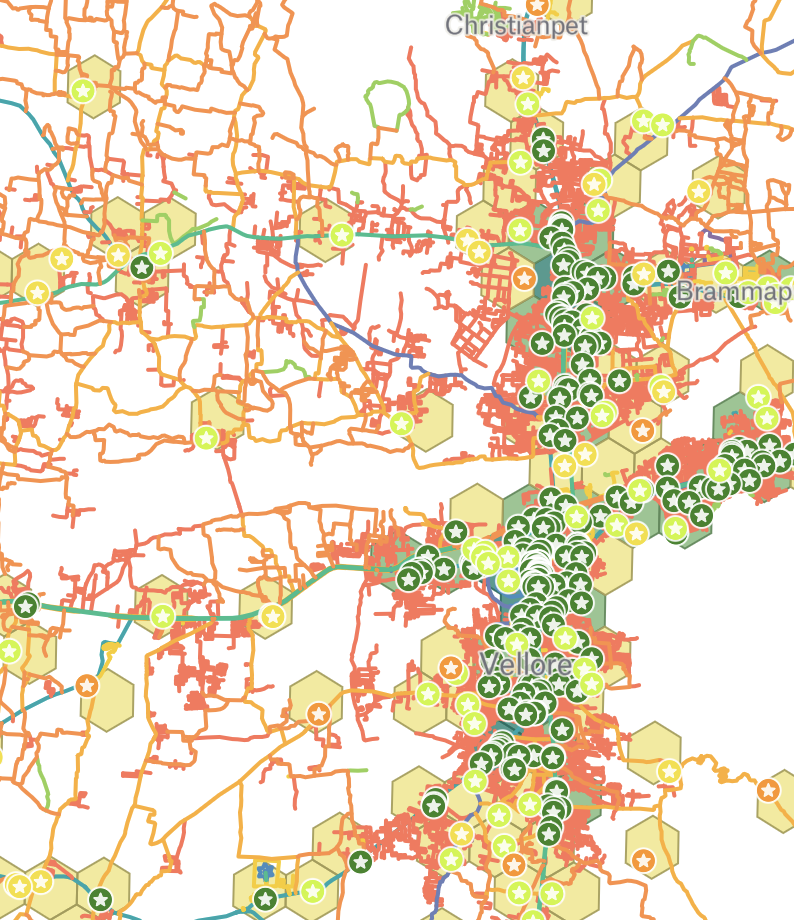
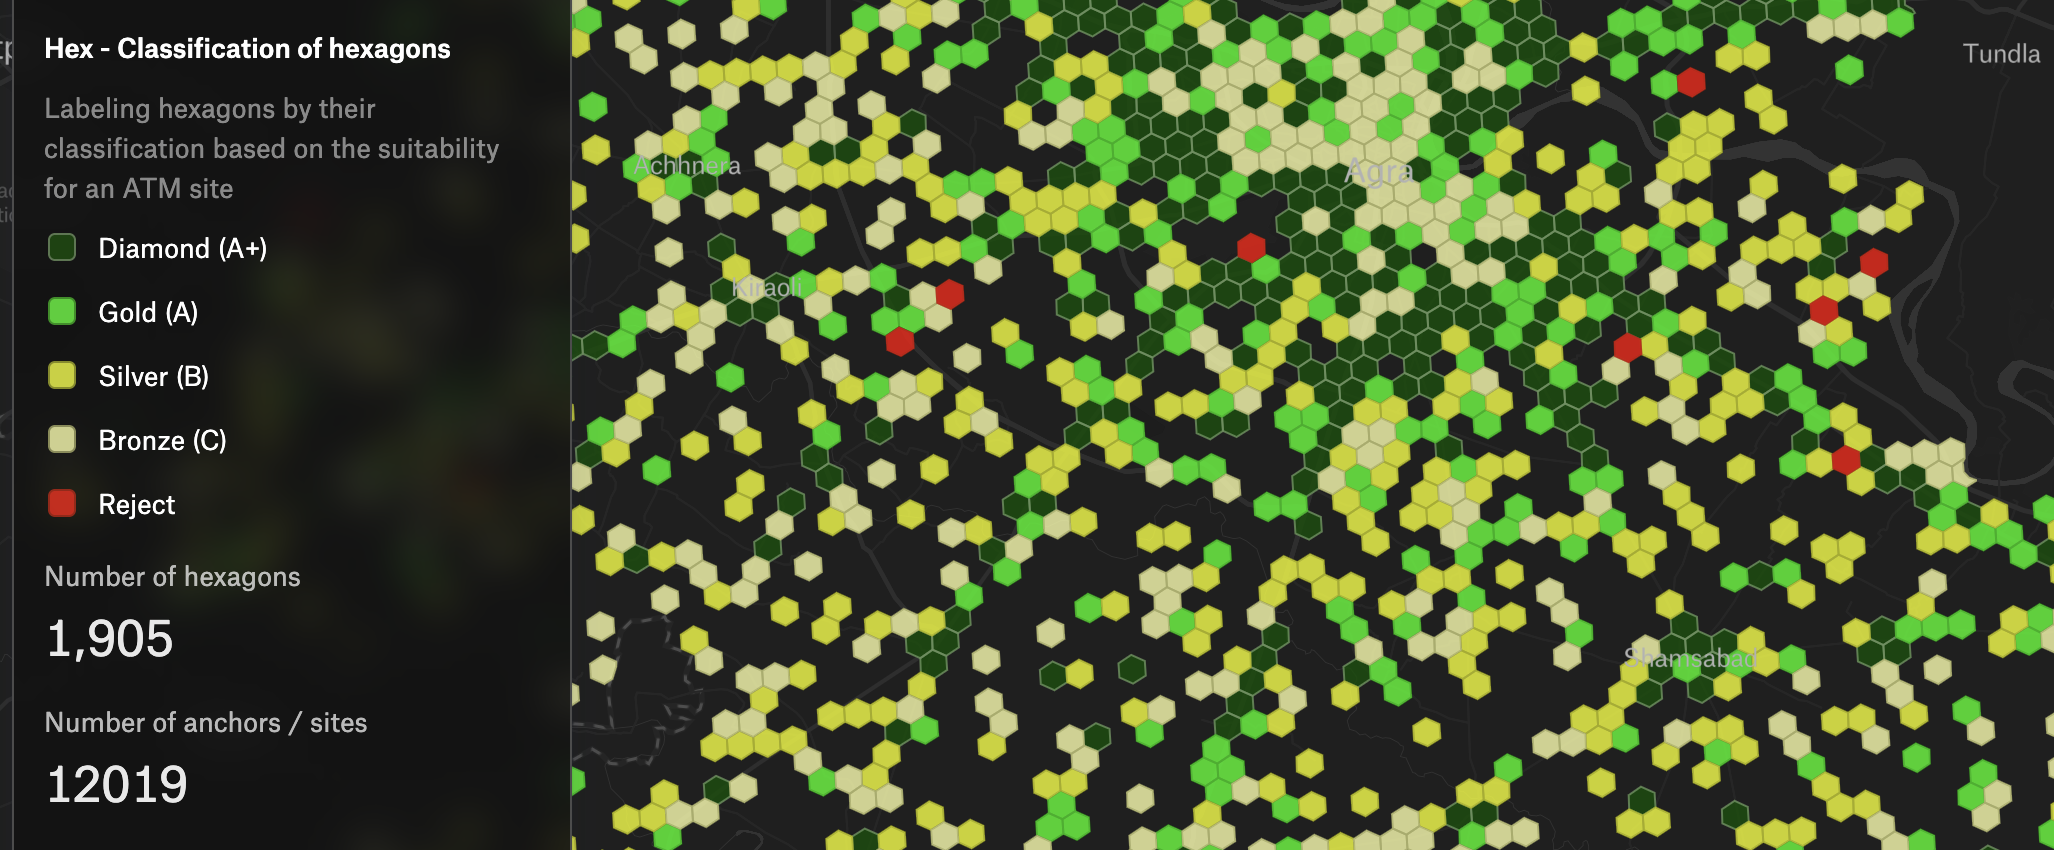
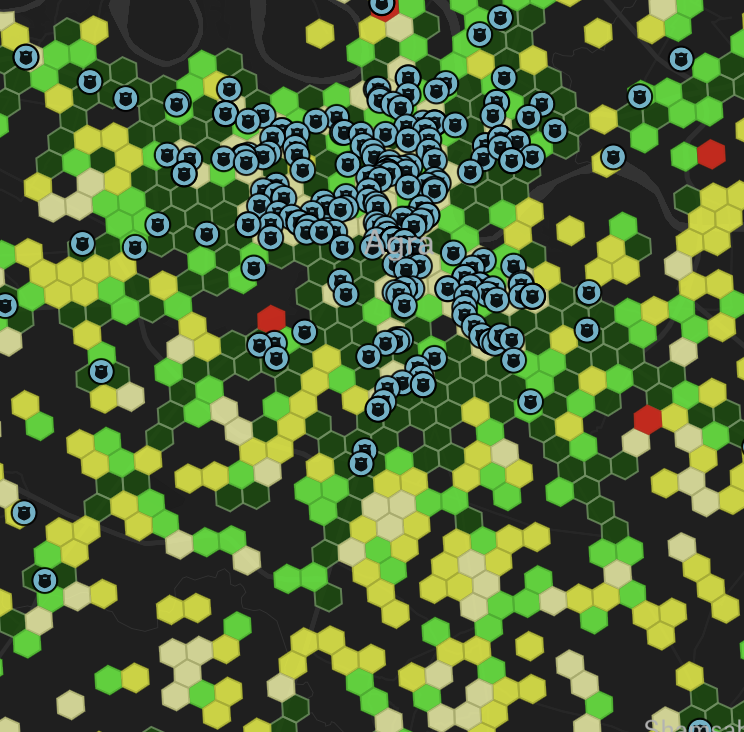
Every district is reduced in four steps. Field teams receive the last column.

Each category is weighted by how much physical cash it actually moves.


Machines already inside a 300-metre catchment are treated as a direct claim on the same demand.
Anything within 150 metres of a PSU ATM or 300 metres of a private one is excluded outright, including the operator's own machines, so the model cannot recommend cannibalising an existing site.
One output per role. No new system to adopt.

Which markets to prioritise, which to hold, and how deployment capacity should be allocated, decided at HQ before scouts are dispatched.

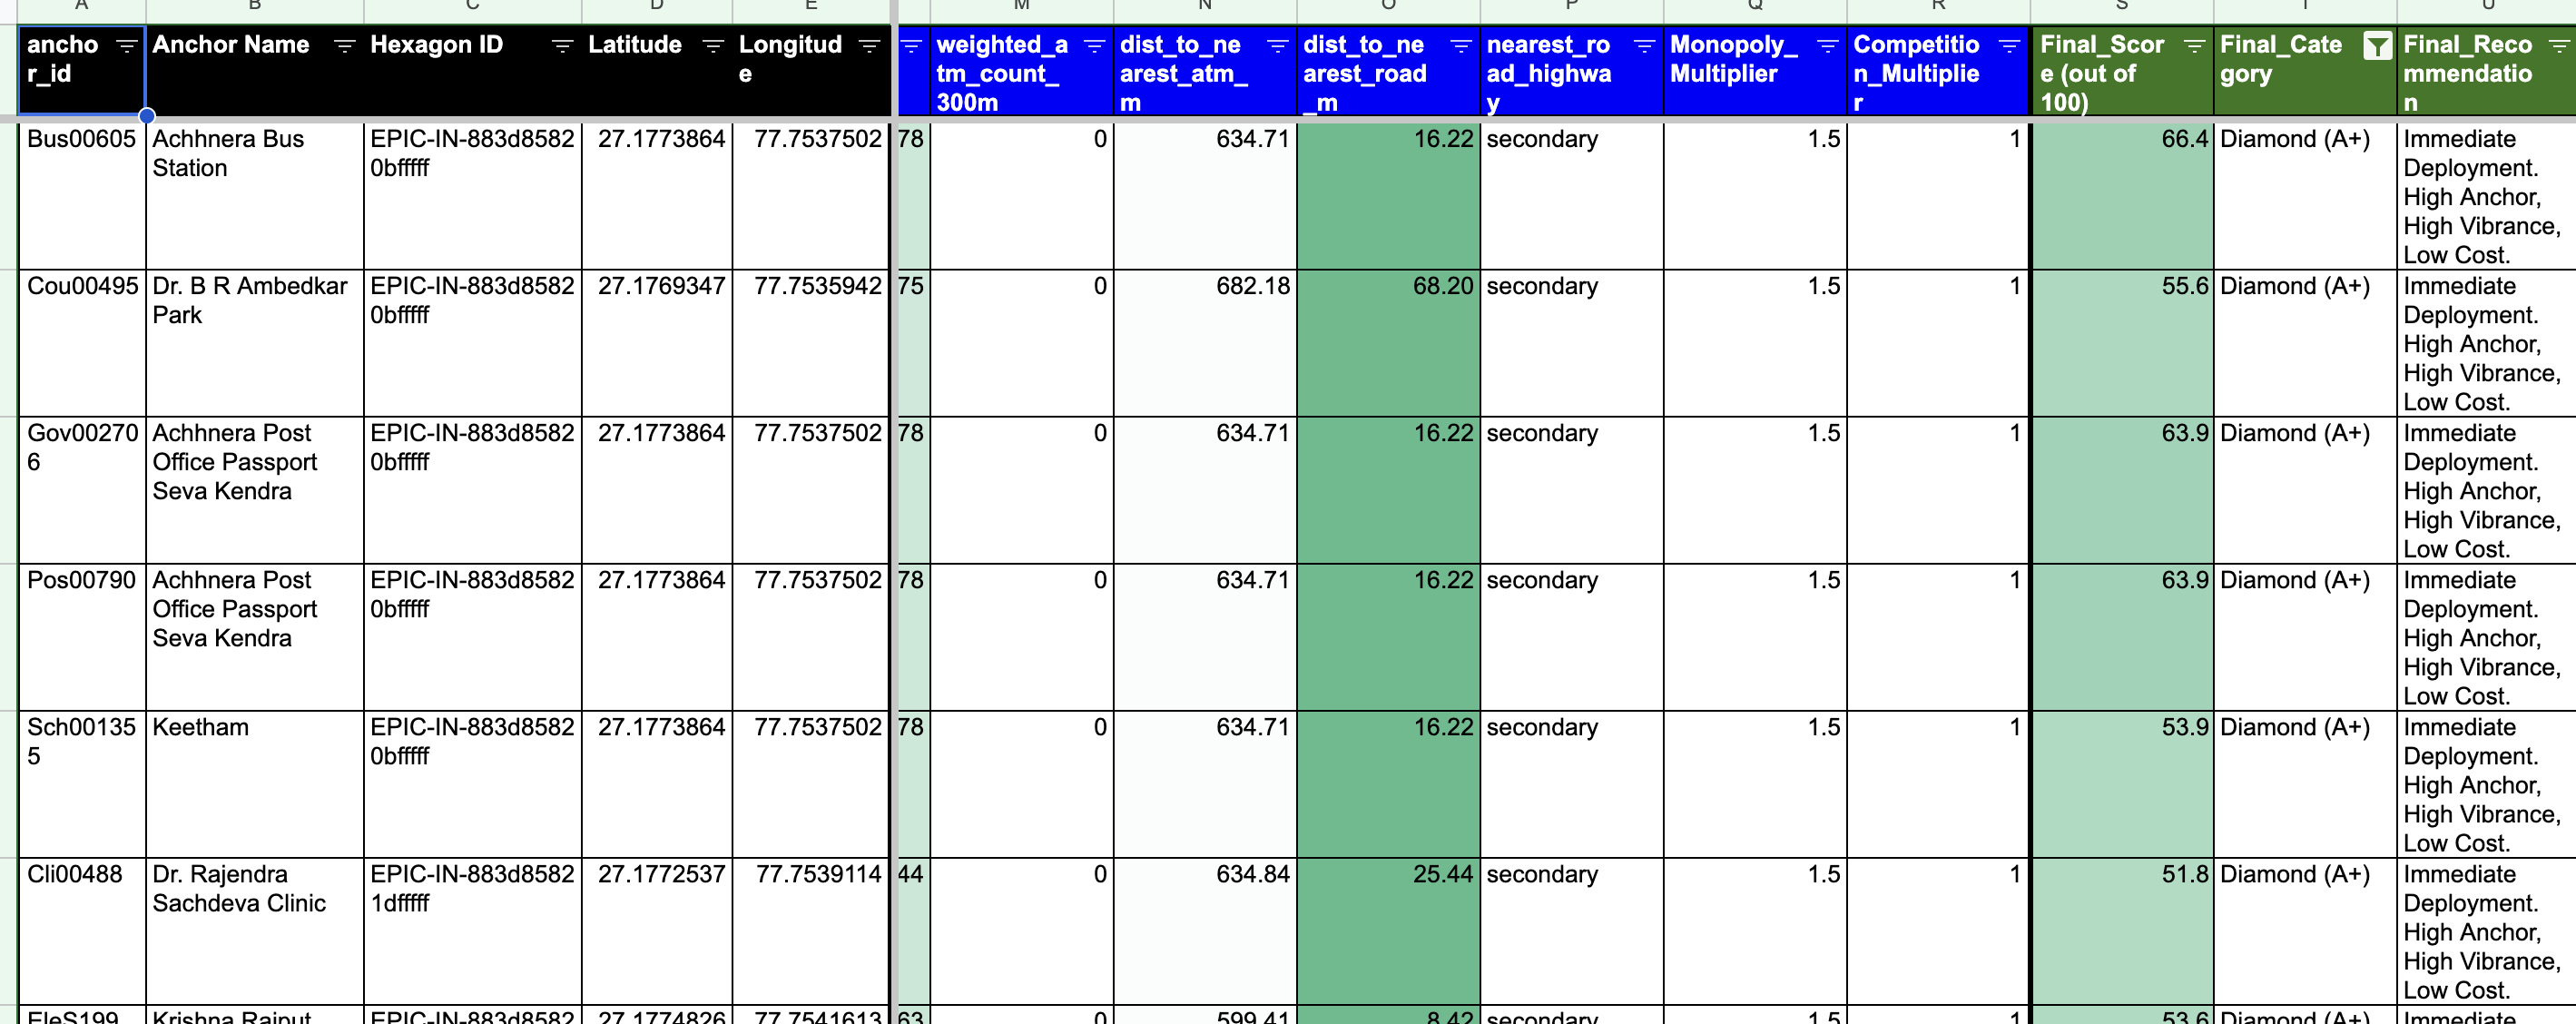
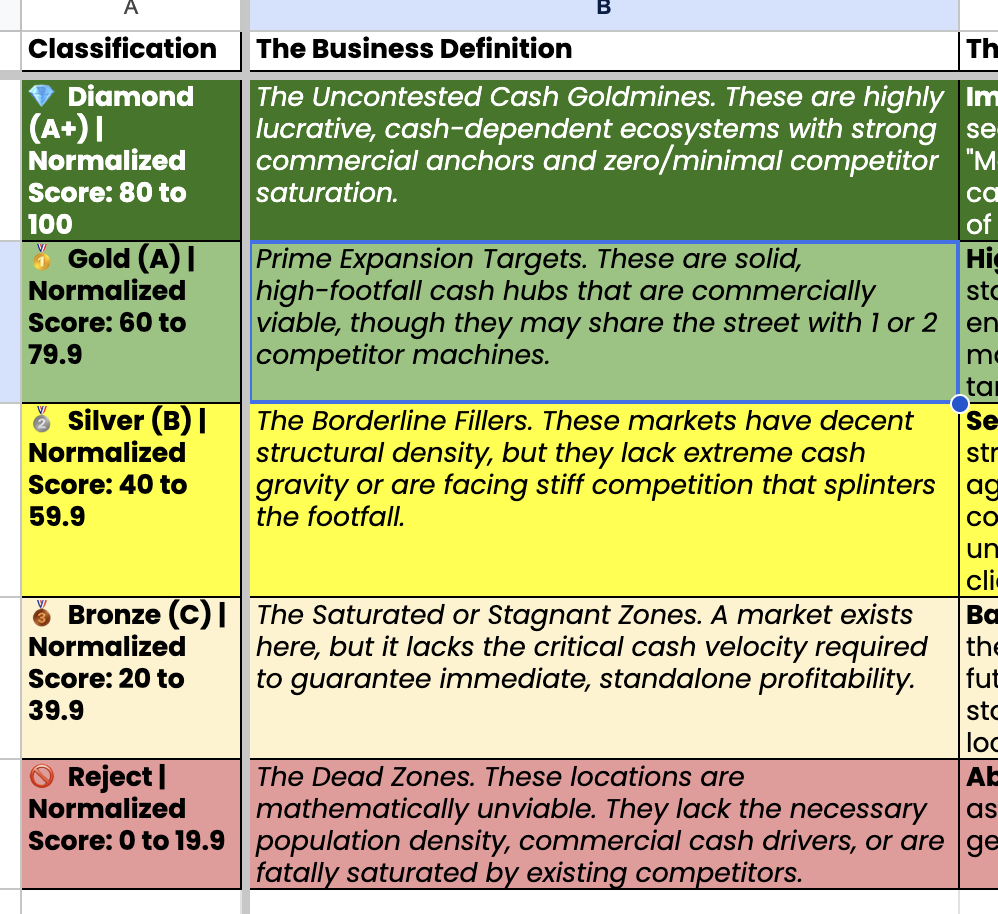
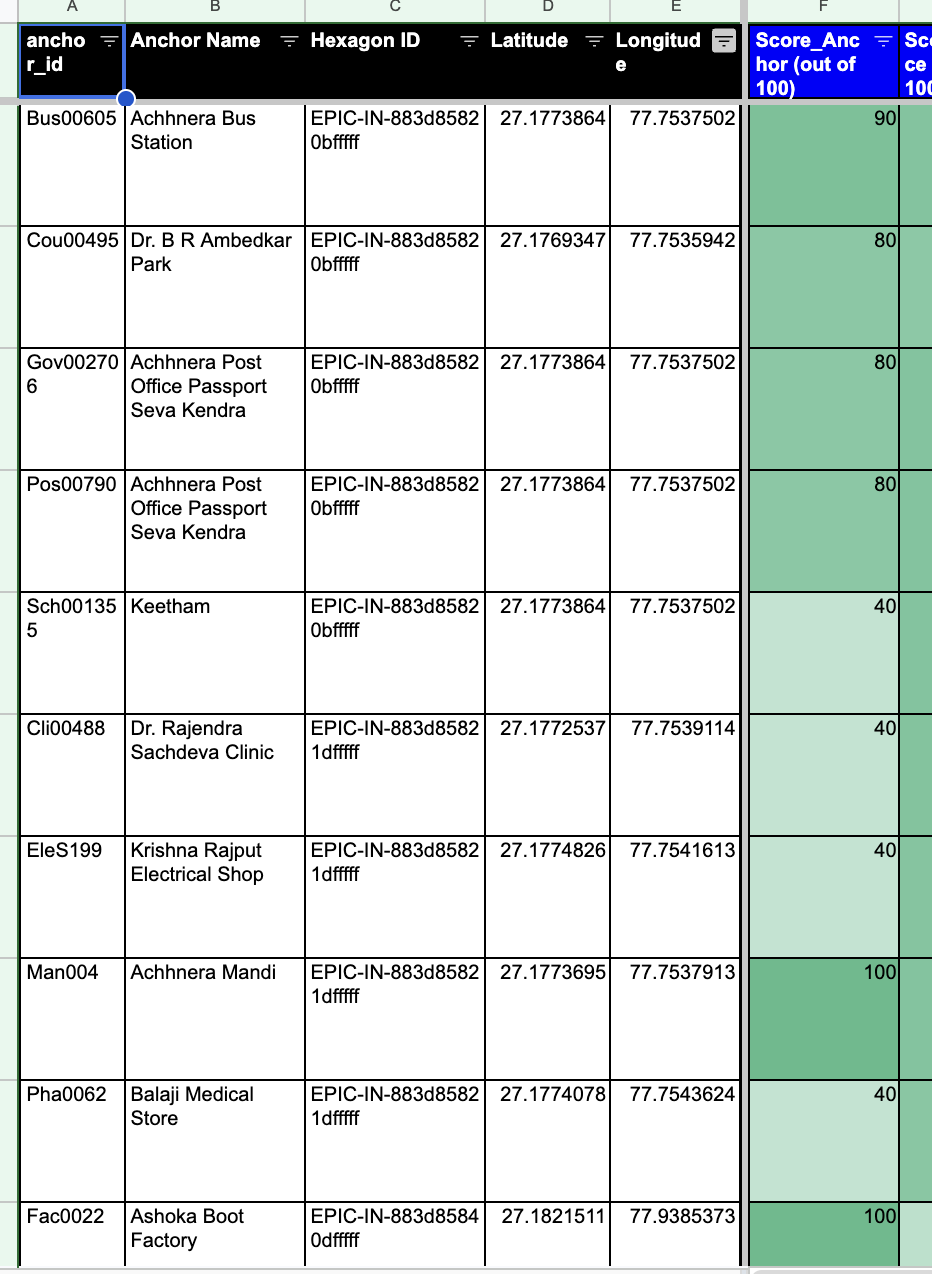
Named locations with coordinates and a score band, each carrying the reason it ranked: transit hub, dense commerce, industrial payroll.

Sites reviewable against satellite imagery and surrounding conditions before travel. The task shifts from finding candidates to confirming them.
Before any new machine was placed, the model was back-tested against the operator's existing ATMs in live markets. It matched real-world performance in roughly seven out of ten cases, working from public signals alone, with no access to transaction data.
Two markets ran as a controlled pilot. Once the shortlists held up against field judgement, the approach was extended into the wider district programme.
As anonymised transaction data is layered in, model accuracy is expected to move into the 80 to 85% range.
"Viable" was defined by the client, in advance. The operator's field teams set the standard for what counts as deployable, not EPIC.
The baseline was captured first. Existing scouting productivity was measured before any shortlist was issued, so improvement is a measured delta.
Scoring is transparent, not black-box. Every recommendation carries its rationale, so field teams can challenge it on the ground.
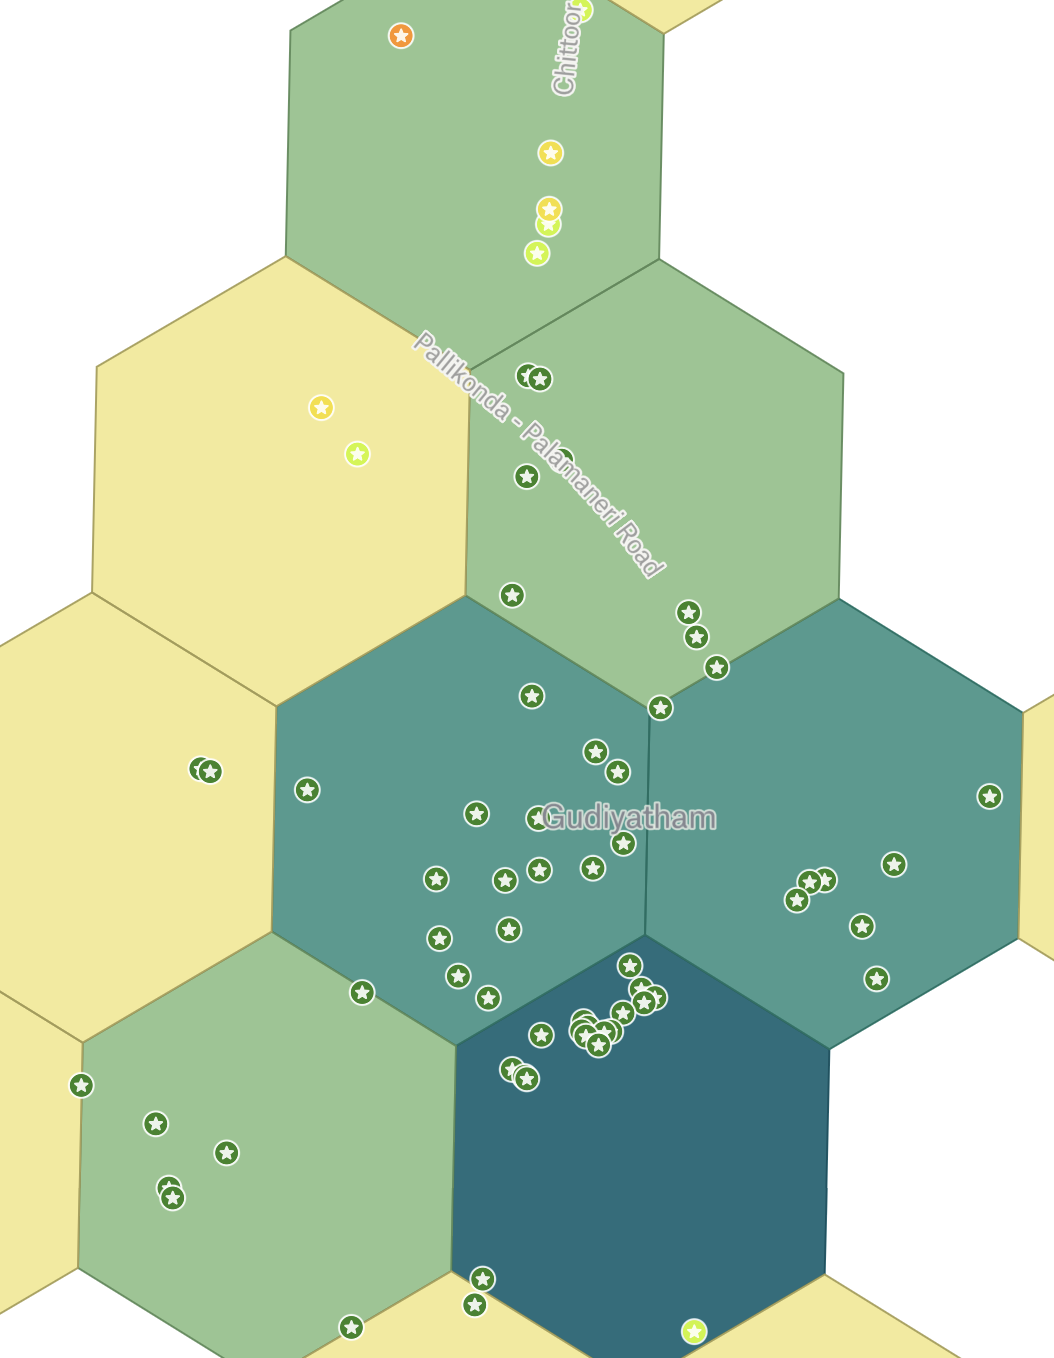
Area scores narrow the search. They do not place a machine. What the field team receives is the anchor: a specific location with a defined catchment, a competition penalty and a serviceability score attached.
Choose a district you know well. We will score it, share the shortlist, and you can tell us where the model is wrong.
Set up a workshop